
Evaluation of the Green Infrastructure Fund (April 2021)
Evaluation of the Green Infrastructure Fund (April 2021)
The Green Infrastructure Fund (GIF) was a $735-million contribution program that funded large-scale green infrastructure projects. Under the program, there were four categories that were eligible for funding: wastewater; green energy generation and transmission; carbon transmission and storage; and solid waste management. The program started in 2009-10 and is scheduled to end in March 2022. Between April 1, 2009 and March 31, 2019, the number of approved projects under GIF, INFC’s contribution and claims paid were as follows:
|
GIF program overview (April 1, 2016 to March 31, 2019) |
||
|---|---|---|
|
21 projects |
$735.3 million in federal contributions |
$441.3 million in claims paid |
Source: Infrastructure Canada Financial Report, April 3, 2019.
Claims for GIF projects continued to be paid and outcome reports received after this period, though these were outside of the scope of this evaluation.
Infrastructure Canada’s evaluation of GIF assessed the extent to which the program addressed infrastructure needs, progress towards expected outcomes, and the extent to which projects were inclusive.
Key findings
GIF addressed needs for green infrastructure funding.
Source: Infrastructure Canada Financial Report April 3, 2019.
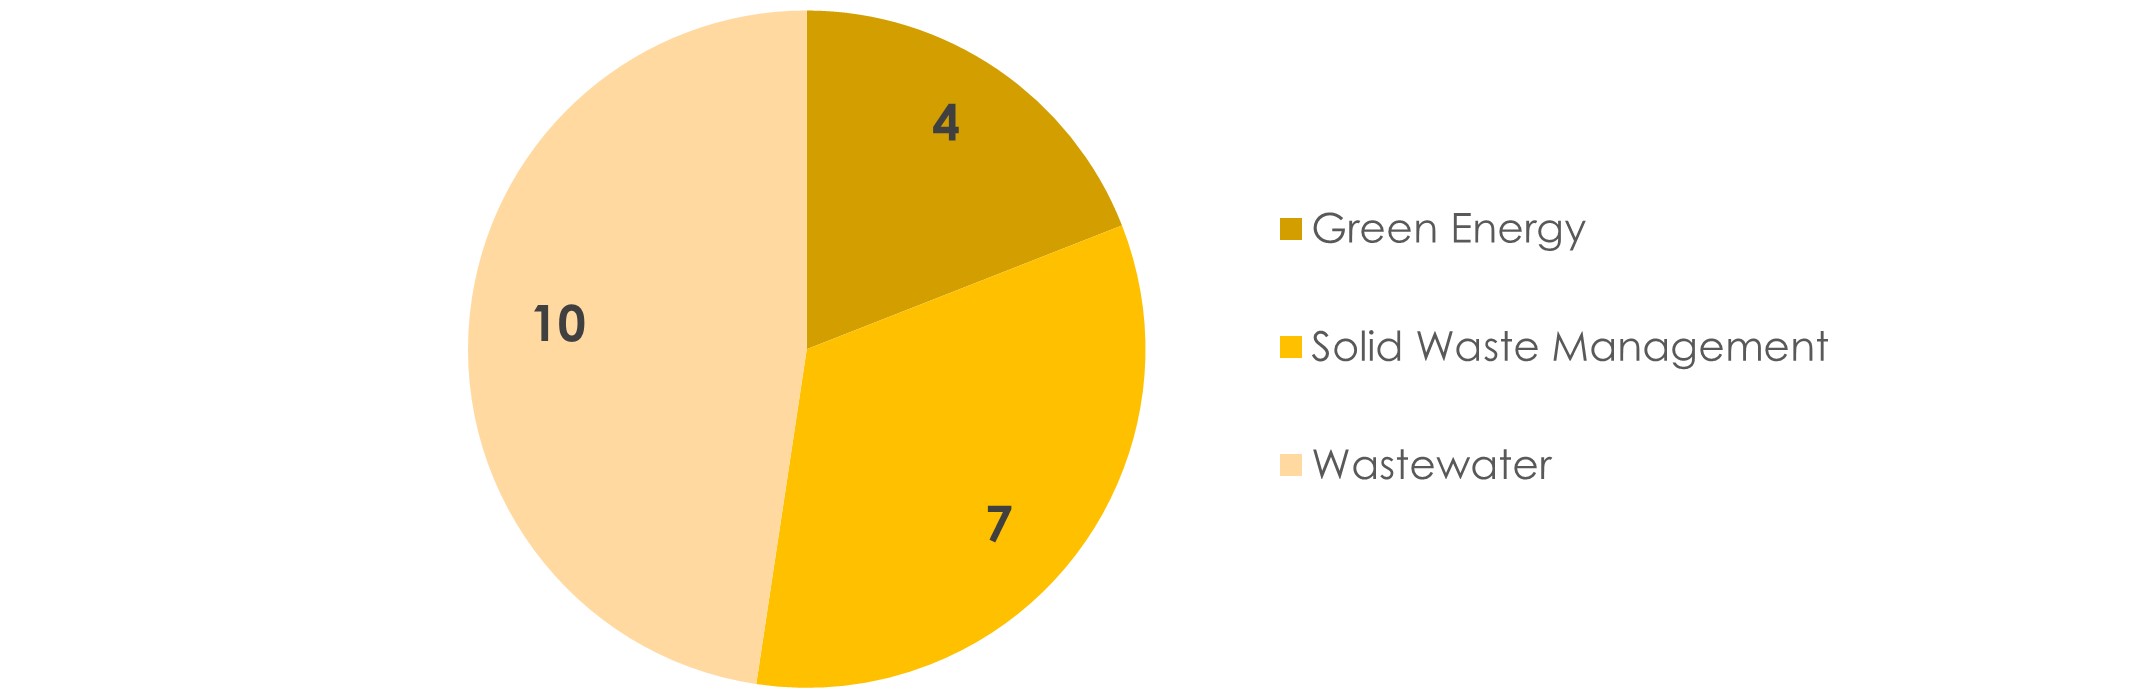
Text description of figure 1
- Green energy 83.
- Wastewater 34.
- Solid Waste Management 36.
Figure 1: Number and distribution of approved projects
This figure represents the number of applications submitted by identified need/ priority. The distribution is as follows:
Progress has been made towards GIF’s outcomes.
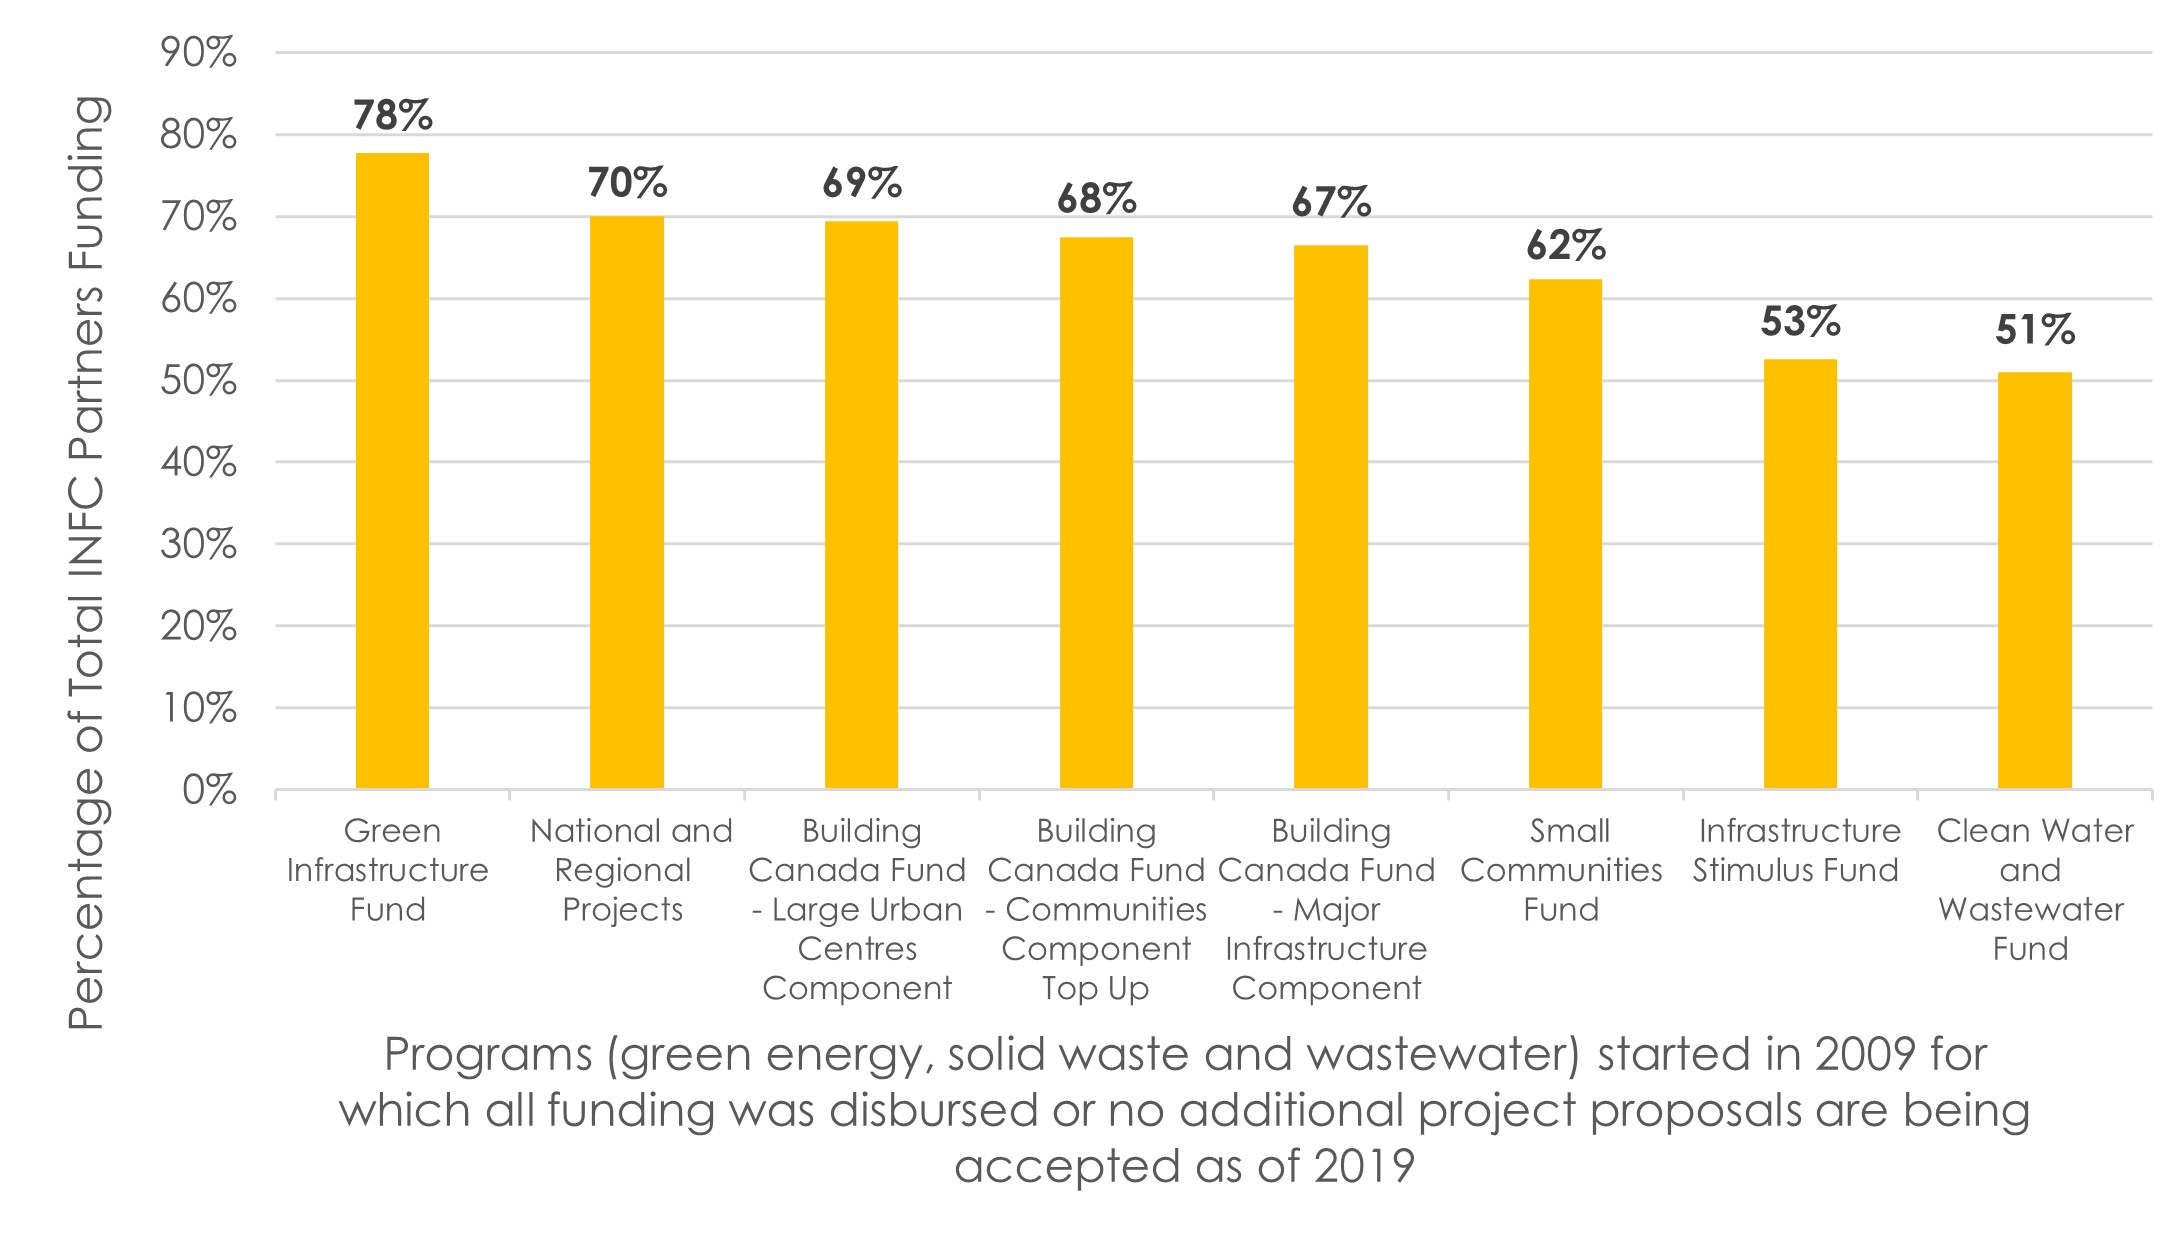
GIF has leveraged more funding from external sources than any other INFC green program.
Source: Infrastructure Canada Financial April 3, 2019.
Text description of figure 2
- Green Infrastructure Fund 78% of total INFC partners funding.
- National and Regional Projects 70% of total INFC partners funding.
- Building Canada Fund - Large Urban Centres Component 69% of total INFC partners funding.
- Building Canada Fund – Communities Component Top Up 68% of total INFC partners funding.
- Building Canada Fund – Major Infrastructure Component 67% of total INFC partners funding.
- Infrastructure Stimulus Fund 53% of total INFC partners funding.
- Clean Waster and Wastewater Fund 51% of total INFC partners funding.
Figure 2: Leveraging funding from partners for GIF and other INFC green programs
This figure presents the percent of funding GIF has leveraged from INFC partners for the funding categories of green energy, solid waster and wastewater. The distribution is as follows:
Although progress has been made towards helping to improve environmental quality, it is not possible to assess the extent of progress made.
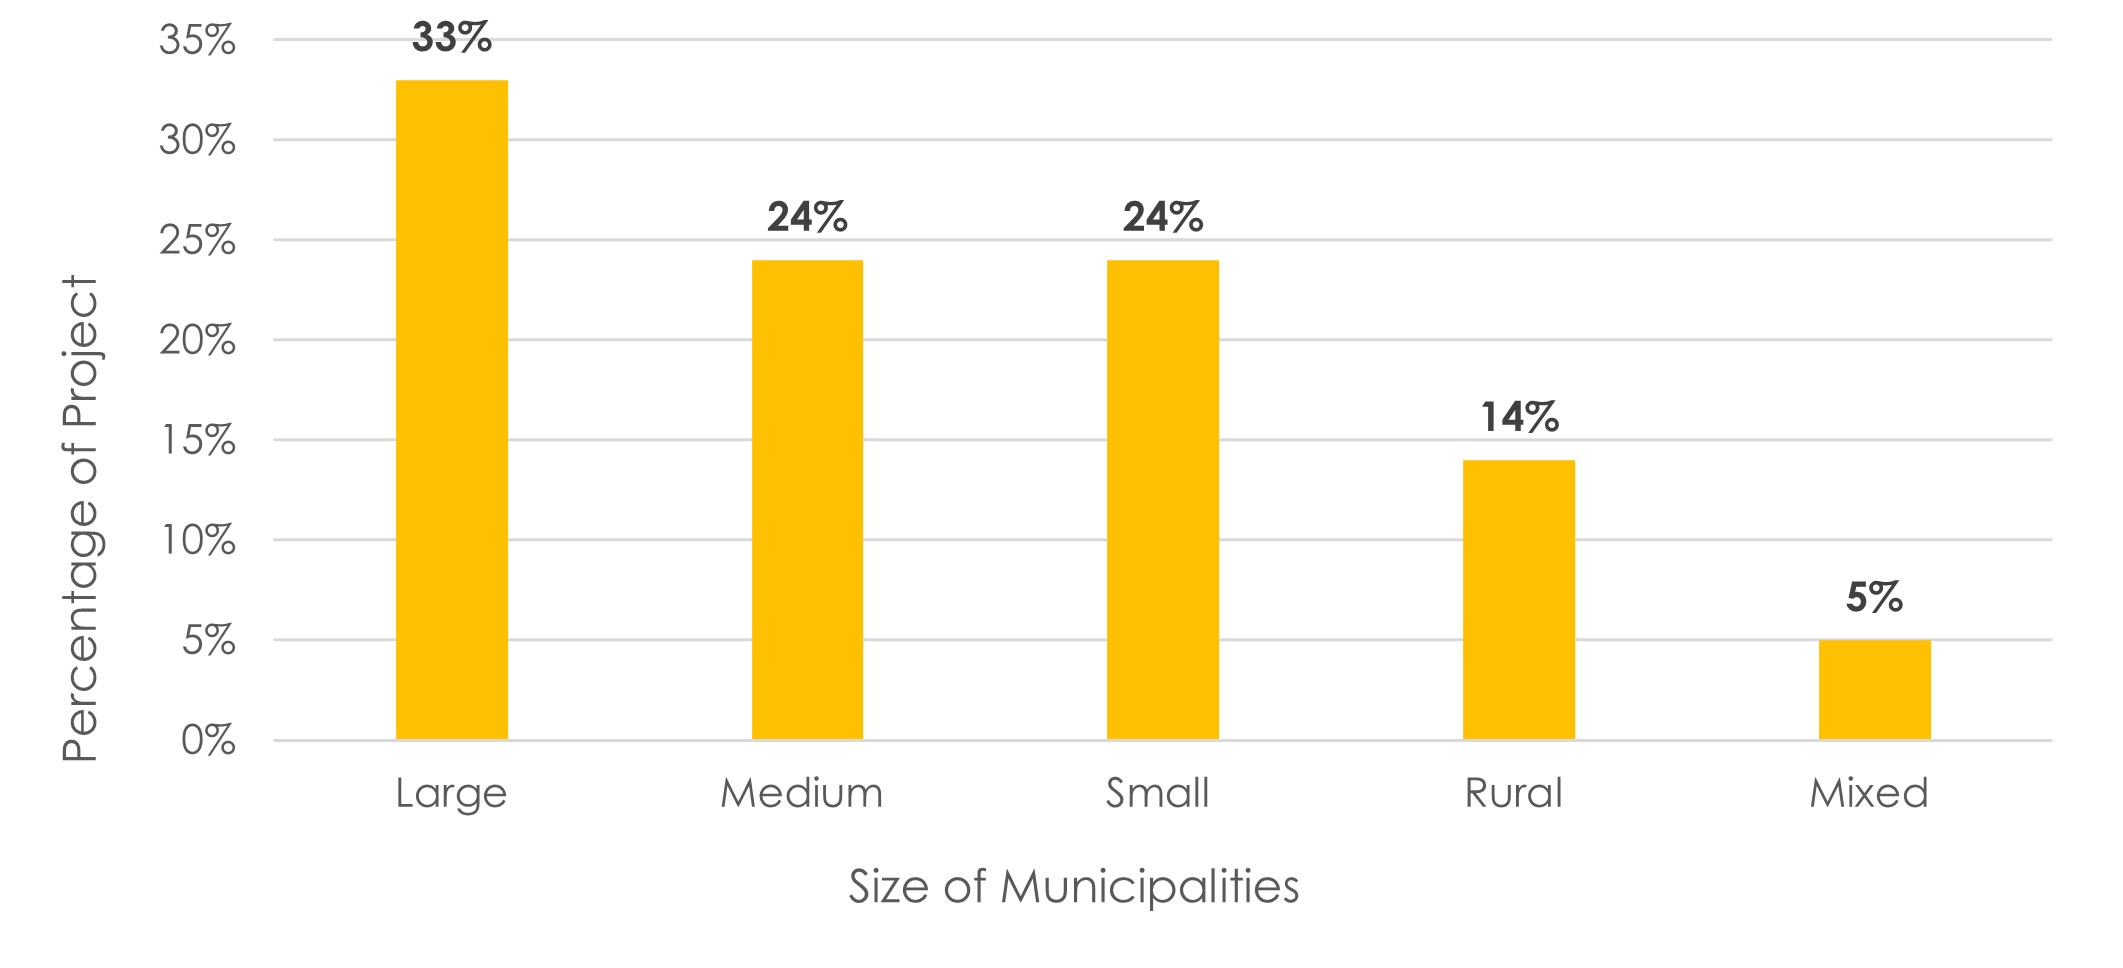
Municipalities of diverse sizes had access to funding.
The evaluation went beyond assessing the extent to which GIF met the requirements for gender-based analysis plus in program development and implementation, to examine program results and external data through an inclusiveness lens more broadly. The intention of this analysis was not to draw conclusions on the relevance or effectiveness of GIF, but rather to use available data to identify potential areas to consider in the development of future infrastructure programming. This analysis, looked at locations where projects took place to determine the distribution across different population center sizes and across provinces and territories. As GIF benefited municipalities of diverse sizes, no considerations are being proposed for future program design.
Source: Infrastructure Canada Financial Report, April 3, 2019 and Statistics Canada Census Data 2016.
Text description of figure 3
- 33% of projects took place in large population centres more than 100,000 people,
- 24% of projects took place in medium population centres more than 30,000 people.
- 24% of projects took place in small population of more than 1,000 people.
- 14% of projects took place in rural locations.
- 5 % of projects took place in more than one location.
Figure 3: distribution of projects funded under GIF as per size of municipality
This figure represents the distribution of projects funded by size of municipality. The distribution is as follows:
The evaluation has no recommendations as GIF is sunsetting and all funds are committed.
Page details
- Date modified: