
Minister of Housing, Infrastructure and Communities Transition Book 3 (2023)
The State of Infrastructure, Housing, and Homelessness
Infrastructure Canada is now Housing, Infrastructure and Communities Canada
With the passing of Bill C-59 on June 20, 2024, Infrastructure Canada (INFC) is now officially the department of Housing, Infrastructure and Communities Canada (HICC). We are currently making updates throughout the website to reflect this change.
Minister of Housing, Infrastructure and Communities Transition Book 3 (2023)
The State of Infrastructure, Housing, and Homelessness
- Part A: The state of infrastructure
- What is Infrastructure?
- Does Canada have the right kind of infrastructure to meet current and future needs?
- Infrastructure as a shared priority
- Infrastructure investments have nearly doubled in the last two decades
- Having an understanding of infrastructure average age and remaining service life helps asset owners to inform early planning and management
- The condition of infrastructure in Canada
- Asset management capacity is lower in smaller municipalities, and varies significantly among provinces and territories
- Current and future infrastructure investments are influenced by key economic, socio-demographic and environmental factors
- Cross-sectoral impacts of infrastructure - The economy
- Cross-sectoral impacts of infrastructure - The environment
- Cross-sectoral impacts of infrastructure - Our communities
- The state of infrastructure – A summary
- Part B: The state of housing
- An overall picture f housing tenure in Canada
- Canada's housing system has long targeted homeownership
- Current and future housing supply challenges in perspective
- Short-term outlook not favourable to increasing supply
- Rental supply outpaced by demand
- Rental market tightening as population and ownership prices grow
- Choices for low-income renters are limited
- The rental market is also challenged by age of stock and source of supply
- Who is being impacted by the rental supply challenge?
- Aging social and affordable housing stock
- Core housing need is higher in certain regions and populations
- The state of housing – A summary
- Key housing terminology
- Part C: The state of homelessness
- Key definitions
- Despite significant federal investments, homelessness is increasing
- National shelter capacity
- Homelessness in Canada: 2020-22 Point-in-time counts
- Homelessness in Canada: Demographics
- Economic trends and contributing factors to homelessness
- Homelessness in Canada: Pathways into homelessness
- The state of homelessness – A summary
Part A: The state of infrastructure
What is Infrastructure?
Infrastructure is a set of tangible assets that support the production, delivery and consumption of goods and services by governments, organizations and individuals. Examples of these assets include schools and hospitals; roads, rails and ports; potable water and water treatment facilities; and cultural and recreational facilities.
Governments generally support public infrastructure, which is subset of total infrastructure and refers to assets that provide a service to the public, such as public transit, broadband connectivity, electricity and libraries.
The construction of infrastructure involves a broad range of industries – ranging from natural resources (e.g., mining) and manufacturing (e.g., cement), to engineering and construction.
Does Canada have the right kind of infrastructure to meet current and future needs?
To answer this question, it is important to understand Canada's current state of infrastructure, which can be assessed in a number of ways:
- Stock: Accumulation of an inventory of tangible infrastructure assets over time.
- Investment: Infrastructure spending for the purposes of construction of tangible assets.
- Condition: Standardized scale used to define the current state of an infrastructure asset (i.e., very good, good, fair, poor, or very poor).
Given the changing nature of Canadian society – demographic change, the growth of cities, climate change – understanding current assets cannot tell us whether what we have is what we will need in future.
All asset owners and governments need to be considering how future challenges will impact their need for infrastructure. This can be achieved through asset management practices, and efforts like the National Infrastructure AssessmentFootnote 1, which is intended to provide a long-term perspective on Canada's infrastructure needs.
Infrastructure as a shared priority
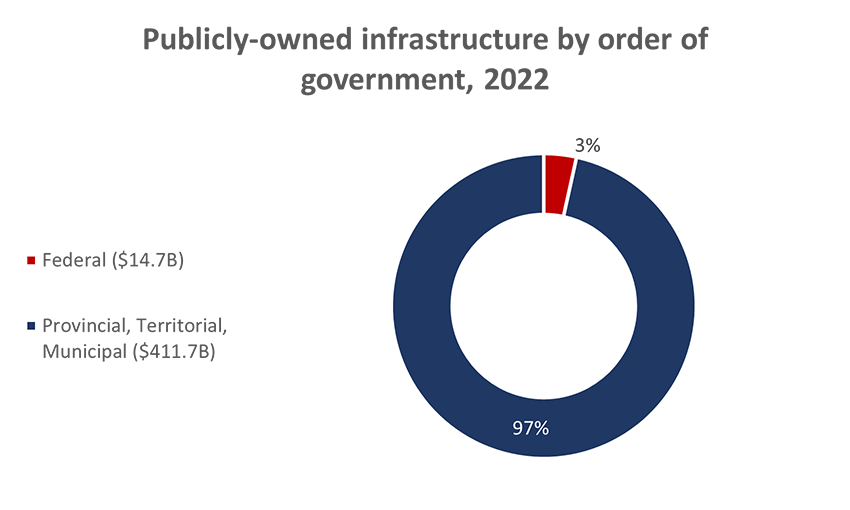
Infrastructure investments are a shared responsibility, with the federal government generally partnering with other orders of government to invest and deliver public infrastructure.
The public sector owns over two-thirds of infrastructure
- 71% of infrastructure in Canada is publicly owned, but the public share varies by asset.
Provinces, territories, and municipalities play critical roles
- 97% of infrastructure is owned by provinces, territories and municipalities.
Collaboration is key to delivering quality infrastructure
The federal government doesn't own much infrastructure but acts as a funder and supporter of projects.
The Government of Canada plays a major role in funding and administering infrastructure in First Nations on reserve
The government is partnering with First Nations to advance shared goal of transferring federal programming to Indigenous communities and advance self-determination in infrastructure.

-
Figure 1 - Text version
Stock of Infrastructure, 2022 Asset Group Private Public Energy $162,015,000,000 $167,055,000,000 Institutional Buildings $16,693,000,000 $275,892,000,000 Transportation $32,409,000,000 $219,860,000,000 Water and Wastewater $33,956,000,000 $106,730,000,000 Communication $16,380,000,000 $24,429,000,000 Trains and Buses $51,626,000,000 $1,351,000,000 Marine $11,833,000,000 $11,373,000,000 Other $6,478,000,000 $7,001,000,000
-
Figure 2 - Text version
Publicly-owned infrastructure by order of government, 2022 Ownership Net Stock (Percentage) Federal (14.7B) 3% Provincial, Territorial, Municipal ($411.7B) 97%
Source: Infrastructure Economic Account (Statistics Canada, accessed July 2023).
Note: Net stock was used as a proxy for ownership. The Federal category includes Defense Services; Provincial/Territorial includes Hospitals, Nursing and residential care facilities, and Educational services. Other industries categories: Indigenous (Aboriginal) and Government Business Enterprises are excluded from this analysis.
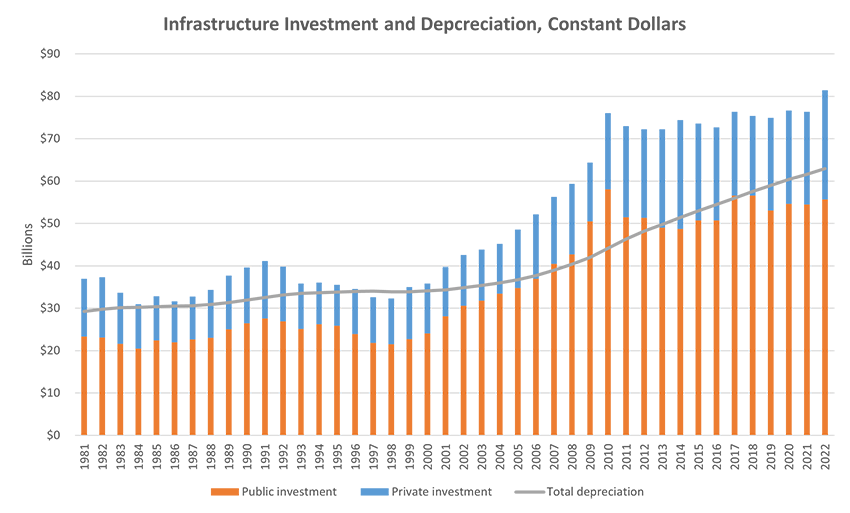
Infrastructure investments have nearly doubled in the last two decades
After stagnating in the late 20th century, real annual investment in infrastructure has nearly doubled from 2002 to 2022.
- Public investment (+82%) has grown more than private investment (+115%). Footnote 2
As the stock of infrastructure grows from increased investment, the level of depreciation to be addressed by sustained, ongoing investment also grows.
- In 2022, $112B was invested in infrastructure, surpassing depreciation by $25B.Footnote 3
- Investment levels since 2000 have meant that the remaining useful life ratio of all assets in Canada has steadily increased from 51.5 to 58.9 – a significant improvement.Footnote 4
-
Figure 3 - Text version
Infrastructure Investment and Depreciation, Constant Dollars Year Private investment Public investment Total depreciation (billions) 1981 $13.633 $23.322 $29.253 1982 $14.164 $23.119 $29.772 1983 $12.039 $21.619 $30.132 1984 $10.430 $20.495 $30.236 1985 $10.414 $22.427 $30.327 1986 $9.691 $21.959 $30.466 1987 $10.107 $22.655 $30.609 1988 $11.292 $22.995 $30.861 1989 $12.652 $25.001 $31.297 1990 $13.205 $26.431 $31.903 1991 $13.595 $27.575 $32.554 1992 $12.860 $26.912 $33.128 1993 $10.740 $25.083 $33.457 1994 $9.823 $26.216 $33.634 1995 $9,692 $25,828 $33,812 1996 $10.621 $23.891 $33.951 1997 $10.786 $21.836 $33.990 1998 $10,762 $21,515 $33,902 1999 $12.290 $22.684 $33.903 2000 $11.719 $24.068 $34.060 2001 $11.644 $28.099 $34.351 2002 $11.923 $30.602 $34.836 2003 $12.053 $31.781 $35.395 2004 $11.810 $33.401 $35.992 2005 $13.774 $34.801 $36.748 2006 $15.195 $36.950 $37.709 2007 $15.768 $40.482 $38.938 2008 $16.599 $42.695 $40.371 2009 $13.821 $50.491 $41.984 2010 $17.948 $58.056 $44.113 2011 $21.485 $51.475 $46.312 2012 $20.853 $51.338 $48.158 2013 $23.279 $48.961 $49.763 2014 $25.724 $48.685 $51.373 2015 $22.784 $50.742 $52.998 2016 $21.948 $50.696 $54.486 2017 $19.714 $56.585 $55.981 2018 $18.800 $56.538 $57.500 2019 $21.870 $53.025 $58.923 2020 $22.044 $54.587 $60.397 2021 $21.880 $54.483 $61.603 2022 $25.735 $55.658 $62.894
Source: Infrastructure Economic Account (Statistics Canada, accessed March 2023).
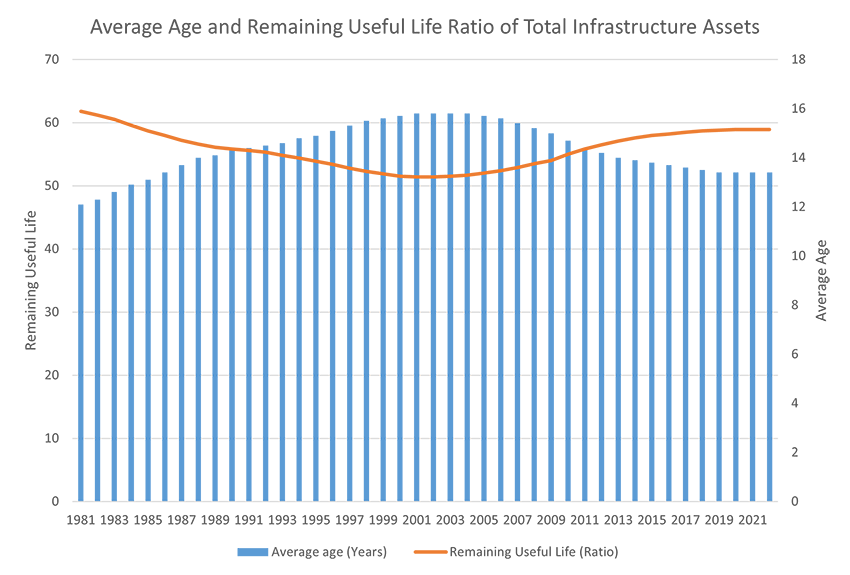
Having an understanding of infrastructure average age and remaining service life helps asset owners to inform early planning and management
The average age and remaining useful service life of infrastructure assets have improved from a low point around 2000 and have remained stable since 2017.
According to the Canadian Infrastructure Report Card, early investment in maintenance and repair, while an asset's service life remains high, can eliminate or delay more costly rehabilitation or reconstruction spending in the future.
-
Figure 4 - Text version
Average Age and Remaining Useful Life Ratio of Total Infrastructure Assets Year Average age (Years) Remaining Useful Life (Ratio) 1981 12.1 61.8 1982 12.3 61.2 1983 12.6 60.5 1984 12.9 59.6 1985 13.1 58.7 1986 13.4 58 1987 13.7 57.2 1988 14 56.6 1989 14.1 56.1 1990 14.3 55.8 1991 14.4 55.6 1992 14.5 55.3 1993 14.6 54.8 1994 14.8 54.4 1995 14.9 53.9 1996 15.1 53.4 1997 15.3 52.8 1998 15.5 52.3 1999 15.6 51.9 2000 15.7 51.5 2001 15.8 51.4 2002 15.8 51.4 2003 15.8 51.5 2004 15.8 51.7 2005 15.7 52 2006 15.6 52.4 2007 15.4 52.9 2008 15.2 53.5 2009 15 54 2010 14.7 55 2011 14.4 55.8 2012 14.2 56.5 2013 14 57.1 2014 13.9 57.6 2015 13.8 58 2016 13.7 58.2 2017 13.6 58.5 2018 13.5 58.7 2019 13.4 58.8 2020 13.4 58.9 2021 13.4 58.9 2022 13.4 58.9
Source: Infrastructure Economic Account (Statistics Canada, July 2023 data)
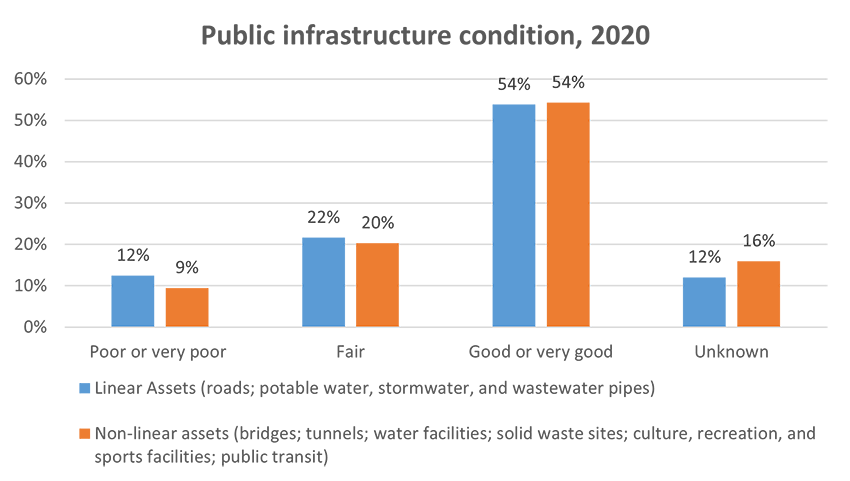
The condition of infrastructure in Canada
About half of Canada's public infrastructure is in good or very good condition
However, asset condition varies among asset types and owners, and many assets are of unknown condition.
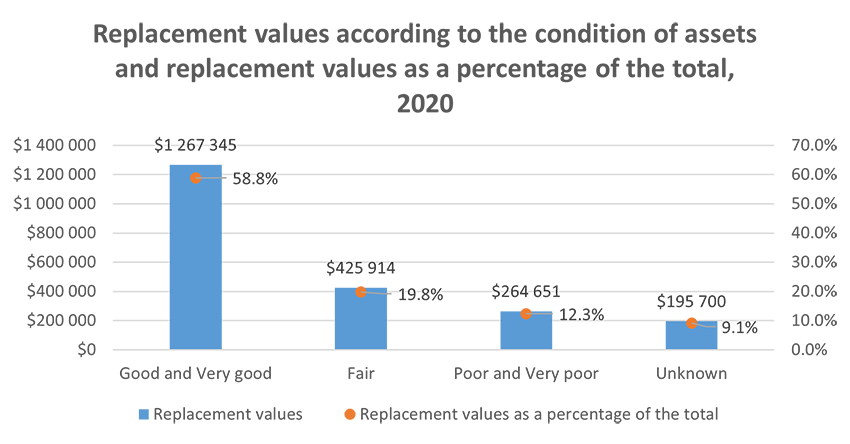
In 2020, the total replacement value of Canada's core public infrastructure was estimated to be $2.15 trillion
More than half (58.8%) of Canada's assets by replacement value are in good and very good condition.
Approximately 12% of assets are in poor and very poor condition, accounting for $260 billion to replace.
Roads and water infrastructure accounted for over three-quarters of the total replacement value.
Rural municipalities owned most of the municipally owned roads (79.1% by length, excluding sidewalks), but they accounted for only 55.8% of the replacement value.
-
Figure 5 - Text version
Public infrastructure condition, 2020 Asset Percentage Condition Non-linear assets (Bridges; Tunnels; Water Facilities; Solid Waste sites; Culture, Recreation, and Sport Facilities; Public Transit) 54% Good or Very Good Non-linear assets (Bridges; Tunnels; Water Facilities; Solid Waste sites; Culture, Recreation, and Sport Facilities; Public Transit) 20% Fair Non-linear assets (Bridges; Tunnels; Water Facilities; Solid Waste sites; Culture, Recreation, and Sport Facilities; Public Transit) 9% Poor or Very Poor Non-linear assets (Bridges; Tunnels; Water Facilities; Solid Waste sites; Culture, Recreation, and Sport Facilities; Public Transit) 16% Unknown Linear Assets (roads; potable water; storm water, and wastewater pipes) 54% Good or Very Good Linear Assets (roads; potable water; storm water, and wastewater pipes) 22% Fair Linear Assets (roads; potable water; storm water, and wastewater pipes) 12% Poor or Very Poor Linear Assets (roads; potable water; storm water, and wastewater pipes) 12% Unknown
-
Figure 6 - Text version
Replacement values according to the condition of assets and replacement values as a percentage of the total, 2020 Dollar Value Percentage Condition $1,267,345 58.8% Good or Very Good $425,914 19.8% Fair $264,651 12.3% Poor or Very Poor $195,700 9.1% Unknown
Source: Canada's Core Public Infrastructure Survey (CCPI), 2020 data (Statistics Canada, accessed March 2023). CCPI primarily samples units at the municipal level, with a census of municipalities with at least 1,000 residents, and a sample of rural municipalities with at least 500 residents.
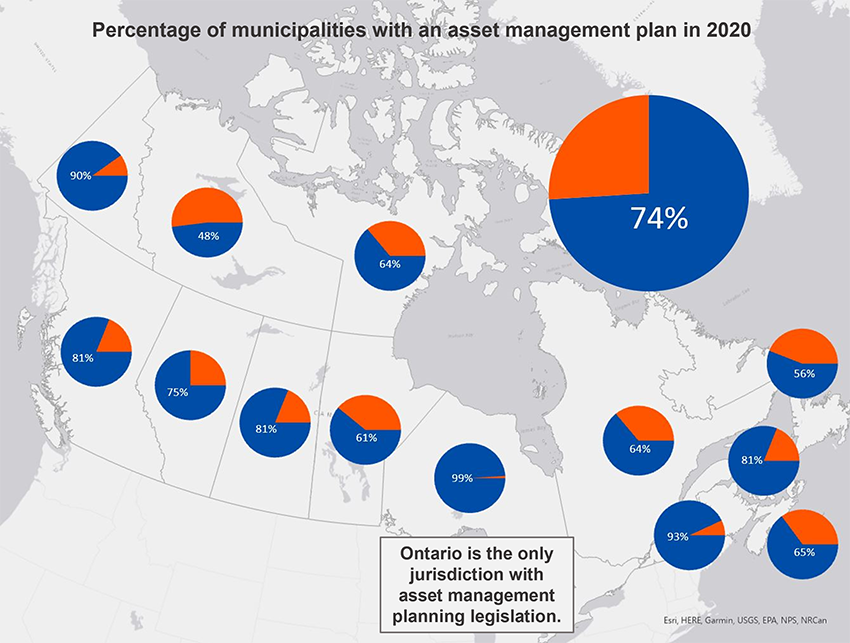
Asset management capacity is lower in smaller municipalities, and varies significantly among provinces and territories
There is notable variation in municipalities having a documented asset management plan, depending on their size:
- 71% of small rural municipalities (i.e., less than 5,000 people) reported a documented plan; the lowest reported group.
- 87.9% of large urban municipalities (i.e., 30,000 people or more) reported a documented plan.
-
Figure 7 - Text version
A map of Canada depicts pie charts for each province and territory indicating the percentage of municipalities with asset management plans.
Percentage of municipalities with an asset management plan in 2020 Province Percent Asset Management Plan Percent No Asset Management Plan Alberta 75% 25% British Columbia 81% 19% Manitoba 61% 39% New Brunswick 93% 7% Newfoundland and Labrador 56% 44% Northwest Territories 48% 52% Nova Scotia 65% 35% Nunavut 64% 36% Ontario 99% 1% Prince Edward Island 81% 19% Quebec 64% 36% Saskatchewan 81% 19% Yukon 90% 10% Canada 74% 26% Ontario is the only jurisdiction with asset management planning legislation.
Source: Canada's Core Public Infrastructure Survey (CCPI), 2020
Current and future infrastructure investments are influenced by key economic, socio-demographic and environmental factors
Canada's population is growing – faster than our G7 peers – increasing pressure on our existing infrastructure while generating additional need for new investments.
Macroeconomic headwinds coupled with elevated interest rates will contribute to higher borrowing costs. Fiscal constraints will require efficient allocation of funding to match real needs.
Extreme weather events are increasing, requiring renewed focus on disaster mitigation, adaption and climate change.
Cross-sectoral impacts of infrastructure - The economy
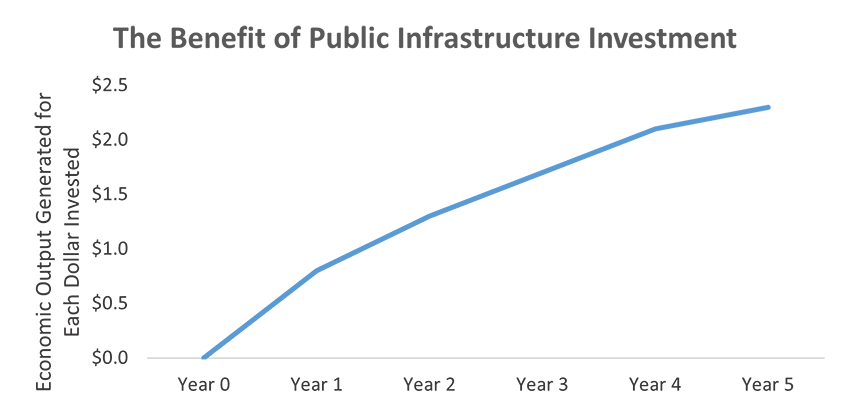
Beyond construction's immediate impact, infrastructure investment contributes to long-term economic competitiveness
The construction sector is essential to the Canadian economy - accounting for 7% of GDP - valued $152 billion. Households and businesses rely on quality infrastructure to facilitate the creation and transportation of goods, services and people that drive the long-term economic growth.
According to the IMF, in advanced economies, every $1 of public infrastructure investment can boost total economic output by $2.3 after 5 years.
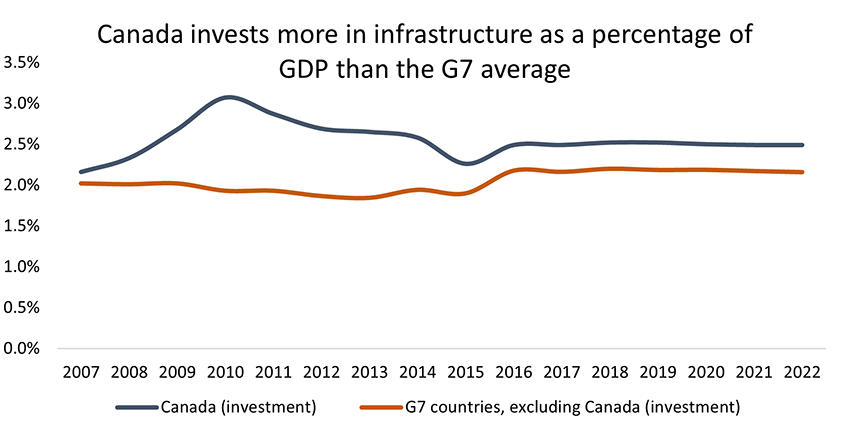
The Global Infrastructure Hub (GIHub) estimates Canada's average infrastructure investment between 2016 and 2022 to be 2.5% of GDP - is 0.32 percentage points higher than the G7 average. However, more investment is needed to meet infrastructure demand – with the (GIHub) recommending additional annual investment of 0.04% of GDP.
-
Figure 8 - Text version
The Benefit of Public Infrastructure Investment Year Economic Output Generated for Each Dollar Invested Year 0 $0.00 Year 1 $0.80 Year 2 $1.30 Year 3 $1.70 Year 4 $2.10 Year 5 $2.30
-
Figure 9 - Text version
Canada invests more in infrastructure as a percentage of GDP than the G7 average Years Canada (investment) G7 countries, excluding Canada (investment) 2007 2.16% 2.04% 2008 2.33% 2.06% 2009 2.68% 2.11% 2010 3.07% 2.09% 2011 2.87% 2.06% 2012 2.69% 1.98% 2013 2.65% 1.96% 2014 2.58% 2.03% 2015 2.26% 1.95% 2016 2.49% 2.22% 2017 2.49% 2.21% 2018 2.52% 2.25% 2019 2.52% 2.23% 2020 2.5% 2.23% 2021 2.49% 2.22% 2022 2.49% 2.21%
Sources: International Monetary Fund (IMF) and Global Infrastructure Hub - A G20 INITIATIVE
A highly productive construction sector is critical to growing our infrastructure
A strong construction sector is needed to sustain Canada's infrastructure
From connecting the country through advanced transit systems to providing roads, community buildings and wastewater facilities, Canadians rely on the construction sector to build essential and resilient infrastructure.
As the sector grapples with stagnant productivity, embracing innovative approaches and new technologies can enable the sector to meet growing demands.
Government transparency on the future of infrastructure will be necessary to foster industry confidence and incentivize the private sector's co-investment for sustained growth.

-
Figure 10 - Text version
Construction Vacancies Surpass Unemployment Year Construction Unemployment Rate Construction Vacancy Rate 2015 9.4% 2.6% 2016 9.1% 2.4% 2017 8.0% 2.8% 2018 6.9% 3.6% 2019 6.9% 3.5% 2020 9.6% 3.5% 2021 6.0% 5.6% 2022 4.7% 6.6% 2023 4.8% 5.1%
Key challenges facing the construction sector:
- Labour shortages
- The construction sector is experiencing an extremely tight labour market with job vacancies exceeding unemployment rates.
- Retainment and recruitment are becoming increasingly difficult and meeting Canada's construction labour force needs will require ongoing commitments to apprenticeship programs, training and recruitment.
- By 2032, 21% of the current construction labour force is expected to retire, leaving a cumulative gap of 155K workers to deliver infrastructure projects throughout the decade.
*Required growth based on estimates of retirements and a 2.8% average annual growth in real investment
-
Figure 11 - Text version
Labour Shortages Year Required Growth in Construction Labour Force* Estimated Growth in Construction Labour Force 2023 53,618.7 40,766.52 2024 57,470.69 41,713.39 2025 57,532.54 42,503.85 2026 56,857.72 41,724.35 2027 56,687.48 42,068.85 2028 58,932.42 42,359.32 2029 59,181.43 42,598.52 2030 57,660.57 42,791.48 2031 59,774.58 42,949.17 2032 60,085.95 43,071.24 Note: *Required growth based on estimates of retirements and a 2.8% average annual growth in real investment
Source: Economic Analysis and Modelling, INFC -
- Volatile commodity prices and supply chain concerns
- Volatile commodity prices and supply chain disruptions are forcing the construction sector to grapple with elevated project costs, project delays or abandonment.
The construction sector is home to high paying jobs but the benefits are not equal across different working groups
Half of infrastructure jobs are concentrated in the construction industry
In 2022, there were 675,400 jobs related to infrastructure in Canada (direct and indirect employment).
Half of the jobs fall under the construction industry, while a third are under information, financial and professional industries as well as distributive trade and transportation.
In direct construction jobs, there were 56.34 million hours worked, with an average hourly wage of $33.8 (compared to a Canadian average of $31.9) in 2022.
Females had a lower average hourly wage than males. Women earned on average $29.5 per hour, while men earned $34.5 in 2022.
Since 2015, the average wage for the unionized construction worker grew by 11%, driven by higher wages in Quebec and British Columbia.
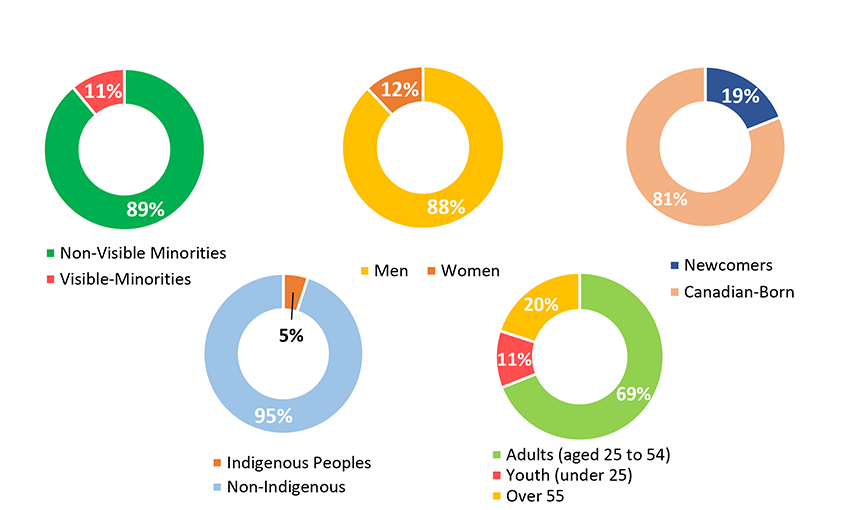
There is untapped potential to diversify the construction labour force
The inclusion of certain groups to the labour force can help alleviate labour shortages and improve gender and visible minority participation; while ensuring that construction wages are distributed proportionally amongst Canadians.
-
Figure 12 - Text version
There is Untapped Potential to Diversify the Construction Labour Force
Non-Visible Minorities vs. Visible Minority
- Non-Visible Minorities: 89%
- Visible Minority: 11%
Men vs. Women
- Men: 88%
- Women: 12%
Newcomers vs. Canadian-Born
- Newcomers: 19%
- Canadian-Born: 81%
Indigenous Peoples vs. Non-Indigenous
- Indigenous Peoples: 5%
- Non-Indigenous: 95%
Adults (aged 25 to 54) vs. Youth (under 25) vs. Over 55
- Adults (aged 25 to 54): 69%
- Youth (under 25): 11%
- Over 55: 20%
Sources: Infrastructure Economic Account; Table 14-10-0037-01; Table 14-10-0064-01 (Statistics Canada)
Construction materials are an integral part of infrastructure delivery and subject to volatility
Key commodities such as cement, steel, lumber and aluminum form the foundation of infrastructure projects
Cement is used in the construction of public transit railways; it is essential for building water treatment plants and is a main ingredient in concrete for residential building foundations.
Steel is utilized in the manufacturing of rail tracks and train stations. It is important for pipelines and pumping stations in water infrastructure as well as for structural frames in building and residential construction.
Aluminum is used in the manufacturing of buses and subway cars, while being an important element in ensuring water infrastructure's resistance to corrosion.
Lumber is used in residential construction for framing as well as exterior and interior finishes.
Prices of construction materials are largely set by global markets and international supply and demand
Increased demand from large countries (e.g. China, U.S.) creates competition for resources and drives prices up.
Supply chain bottlenecks caused by transportation disruptions can lead to price fluctuations.
Extreme climate events (e.g. wildfires) can also have an impact on material availability and costs.
Commodity prices for construction materials are inherently volatile
Factors contributing to volatility include:
- Changes in global economic conditions
- Geopolitical events and trade policies
- Fluctuations in supply and demand dynamics
As such, volatile prices can force the construction sector to grapple with elevated project costs, project delays or abandonment.

-
Figure 13 - Text version
Prices of Key Construction Commodities Year Lumber (USD/1,000 board feet) Aluminum (USD/T) Cement Price Index (Jan 2000 = 100) Hot-Rolled Coil Steel (USD/T) 2009 181 1,673 137.0 484.6926 2010 245 2,175 129.3 610.7333 2011 251 2,401 124.8 733.1884 2012 287 2,021 126.0 657.0502 2013 346 1,846 131.9 630.6667 2014 337 1,871 138.3 652.8996 2015 269 1,681 149.2 460.408 2016 300 1,611 156.5 520.9044 2017 385 1,970 163.2 619.5061 2018 461 2,111 167.0 828.6638 2019 371 1,800 171.0 602.1555 2020 519 1,724 172.8 576.0351 2021 882 2,482 179.6 1591.153 2022 787 2,711 197.1 1005.668 2023 510 2,347 218.8 964.9338
Sources: Trading Economics, FRED Economic Data
Cross-sectoral impacts of infrastructure - The environment
Infrastructure is crucial to mitigating and adapting to climate change
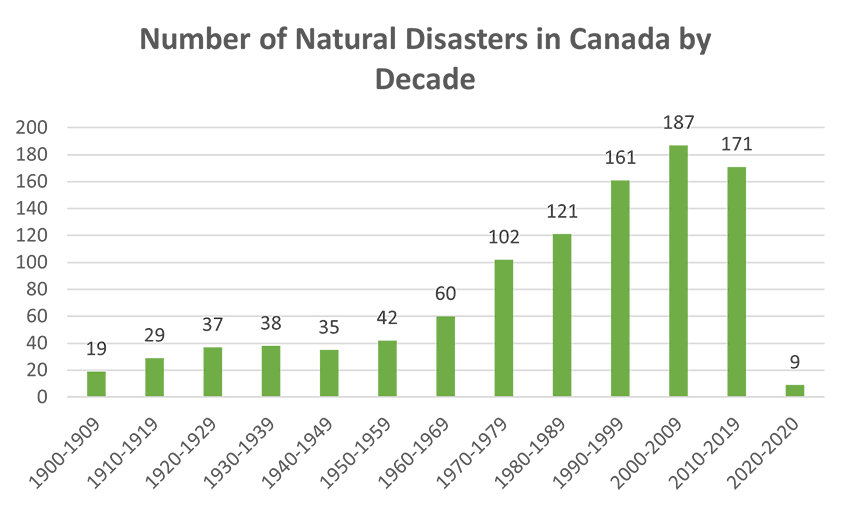
Infrastructure is highly affected by climate change – natural disasters are more frequent and severe
Resilient infrastructure can better withstand and protect communities from impacts of climate change.
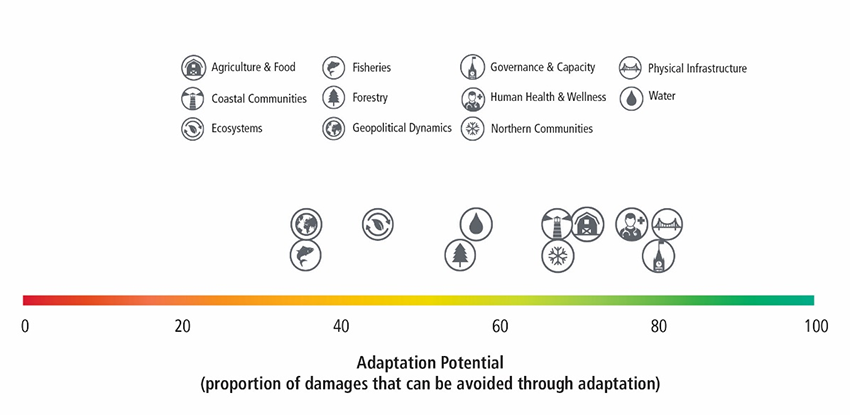
Use of climate-resilient infrastructure offers much potential to reduce risk
Data, guidance, standards and codes can help inform how infrastructure is located, designed, built and operated – to adapt to a changing climate.
-
Figure 14 - Text version
Number of Natural Disasters in Canada by Decade Years Number of Disasters 1900-1909 19 1910-1919 29 1920-1929 37 1930-1939 38 1940-1949 35 1950-1959 42 1960-1969 60 1970-1979 102 1980-1989 121 1990-1999 161 2000-2009 187 2010-2019 171 2020-2020 9
-
Figure 15 - Text version
Adaptation Potential
This figure demonstrates the proportion of damages by category that can be avoided through adaptation measures. Nearly 40% of geopolitical dynamics and fisheries damages can be avoided through adaptation. Over 40% of ecosystems damages can be avoided through adaptation. Nearly 60% of forestry and water damages can be avoided through adaptation. Approximately 70% of coastal communities, northern communities and agriculture and food damages can be avoided through adaptation. About 80% of human health and wellness, physical infrastructure and governance and capacity damages can be avoided through adaptation.
Sources: Canadian Disasters Database (Public Safety Canada, 2023); Canada's Top Climate Change Risks (Council of Canadian Academies, 2019).
Resilient infrastructure requires efficient designs and planning
In 2019Footnote 5, transportation and buildings account for approximately 38% of all greenhouse gas emissions
What is built defines the range of options available to individuals and companies (e.g., transit vs. roads).
How infrastructure is built defines the baseline emissions level, as inefficient designs become "locked in". More efficient future designs are expected to reduce the operational emissions intensity of infrastructure. Current estimates suggest that future efficient designs will reduce operation emissions to 50% from the current level of 89%.
Overall, the percent of municipal owners of infrastructure in Canada that consider climate change mitigation and adaptation in their decision-making process remains low, at less than half of owners for most asset categories.

-
Figure 16 - Text version
Megatonnes of CO2-equivalent emissions by source Year Transportation and Buildings Other Sources 1990 190.5 398.1 1991 185.2 396.8 1992 189.2 410 1993 195.7 406.1 1994 202.1 419.8 1995 205 434.1 1996 214 446.9 1997 215.7 460.7 1998 210.5 472 1999 218.5 476.1 2000 226.1 493.2 2001 222.9 487.3 2002 229.4 486.2 2003 239.8 494.4 2004 243 493.6 2005 241.6 490.6 2006 237.4 487.9 2007 248.2 499.9 2008 248.6 482.1 2009 245.9 443.7 2010 247 454.9 2011 250.4 460.9 2012 249.1 467.2 2013 252.8 470.3 2014 250.9 469.3 2015 247.9 475.1 2016 247.3 457.8 2017 253.1 459.1 2018 261.7 462.9 2019 263.5 460.3 2020 232.3 426.6 2021 237.3 433.2

-
Figure 17 - Text version
Role of climate change adaptation in decision-making process, 2020 Assets Factored in climate change Did not factor in climate change Solid waste 28% 72% Public transit 30% 70% Social and affordable housing 37% 63% Culture, recreation and sports facilities 39% 61% Bridges and tunnels 44% 56% Roads 47% 53% Potable water 47% 53% Wastewater 49% 51% Stormwater 53% 47%
Sources: Greenhouse Gas Emissions (Environment and Climate Change Canada, 2021); GHG Emissions from Building Construction (Green Construction Board, 2014); Canada's Core Public Infrastructure Survey (CCPI)
Environmental improvements are being made during the construction of infrastructure assets
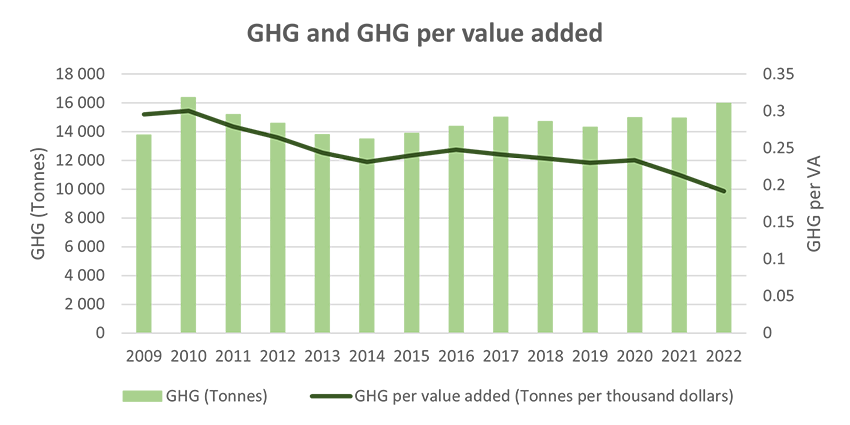
As investment increases, so do the levels of GHG emissions
However, greenhouse gas emissions per value added to the Canadian economy has decreased since 2009, suggesting that environmental improvements are being made during the construction of these assets.
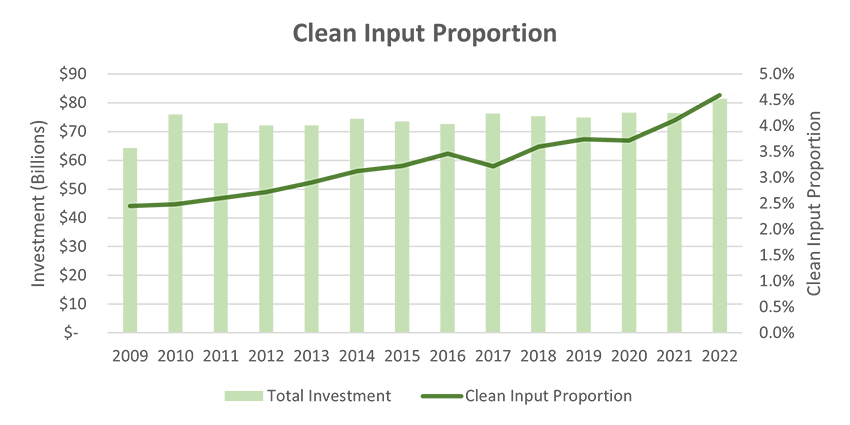
Since 2009, the proportion of infrastructure industries' clean inputs have increased reaching a high of 4.6% in 2022. Environmental and clean technology inputs have increased from $1.57 billion in 2009 to $3.73 billion in 2022.
- The proportion of clean input assesses whether an infrastructure asset was constructed using environmental and clean technology inputs (a process/product/service that reduces environmental impacts).
-
Figure 18 - Text version
GHG and GHG per value added Year GHG (Tonnes) GHG per value added (Tonnes per thousand dollars) 2009 13,756 0.2956 2010 16,376 0.3004 2011 15,176 0.2791 2012 14,585 0.2642 2013 13,784 0.2436 2014 13,475 0.2311 2015 13,881 0.2402 2016 14,365 0.2476 2017 15,001 0.2414 2018 14,698 0.2363 2019 14,316 0.2304 2020 14,969 0.2339 2021 14,932 0.2135 2022 15,977 0.1916
-
Figure 19 - Text version
Clean Input Proportion Years Total Investment Clean Input Proportion 2009 $64,312,000,000 2.4% 2010 $76,004,000,000 2.5% 2011 $72,960,000,000 2.6% 2012 $72,191,000,000 2.7% 2013 $72,240,000,000 2.9% 2014 $74,409,000,000 3.1% 2015 $73,526,000,000 3.2% 2016 $72,644,000,000 3.5% 2017 $76,299,000,000 3.2% 2018 $75,338,000,000 3.6% 2019 $74,895,000,000 3.7% 2020 $76,631,000,000 3.7% 2021 $76,363,000,000 4.1% 2022 $81,393,000,000 4.6%
Source: Infrastructure Economic Accounts (Accessed July, 2023)
Cross-sectoral impacts of infrastructure - Our communities
Infrastructure impacts a community's ability to participate in the economy and provides opportunities to undeserved populations
Connectivity is an essential service and a prerequisite to participate in the digital economy:
- There is still a large gap between those households with access to ultra fast speeds (Gigabit internet) and those without.
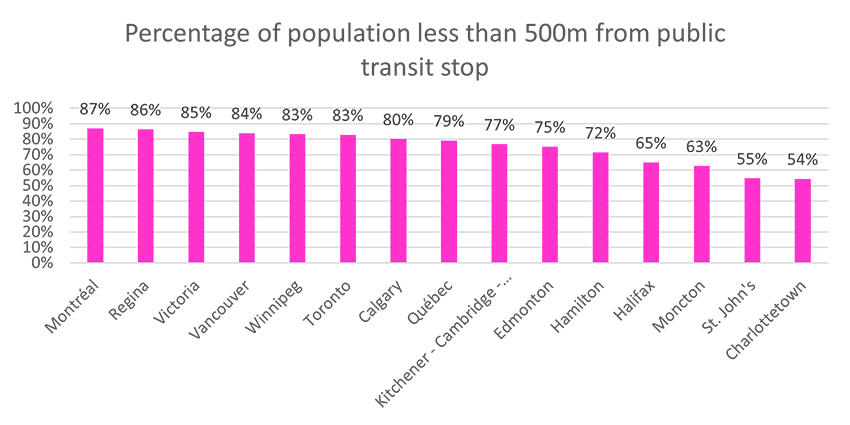
Strong communities requires easy access to social and health services, including high levels of proximity to public transportation in Canada's metropolitan areas:
- Canada's largest metropolitan areas have the most convenient proximity to public transportation at over 80% of the population within 500m of public transit.
- Convenient access to public transport is generally lower in smaller metropolitan areas.

-
Figure 20 - Text version
Broadband Service Availability by Speed (% of households) Year 25 Mbps + 50 Mbps + 50/10/Unlimited 100 Mbps + 150 Mbps + 200 Mbps + Gigabit 2017 92% 85% 84% 84% 79% 62% 50% 2018 94% 87% 86% 85% 80% 77% 65% 2019 95% 92% 87% 86% 84% 84% 61%
-
Figure 21 - Text version
Percentage of population less than 500m from public transit stop City Percentage of population within 500 metres of a public transit stop Montréal 87% Regina 86% Victoria 85% Vancouver 84% Winnipeg 83% Toronto 83% Calgary 80% Québec 79% Kitchener - Cambridge - Waterloo 77% Edmonton 75% Hamilton 72% Halifax 65% Moncton 63% St John's 55% Charlottetown 54%
Source: CRTC Communications Monitoring Report (Accessed July, 2023);
Statistics Canada. Table 23-10-0309-01 Convenient access to public transport by geography
The state of infrastructure – A summary
Canada's infrastructure stock has grown to over a trillion dollars over the last decade. Ongoing investment is needed to offset the effects of depreciation.
To address climate change, improve social inclusion, and support a higher standard of living for Canadians, ongoing partnerships with other levels of government, academia and the private sector are necessary.
Further strengthening infrastructure data and evidence, through partnerships with various data owners including provinces, territories, municipalities, will serve infrastructure decision-makers now and into the future.
Part B: The state of housing
An overall picture f housing tenure in Canada
While the rate of homeownership in Canada has been decreasing in the last decade, this has been from historical highs.
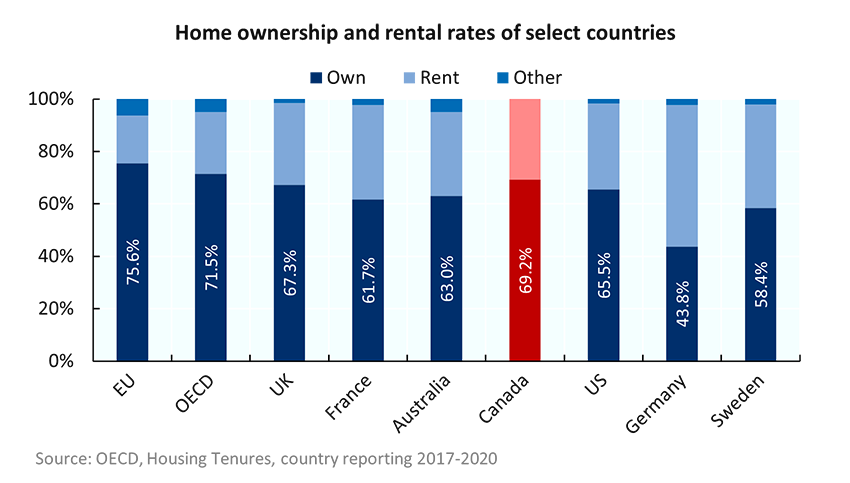
The homeownership rate for Canada is comparable to other select countries and the OECD average.
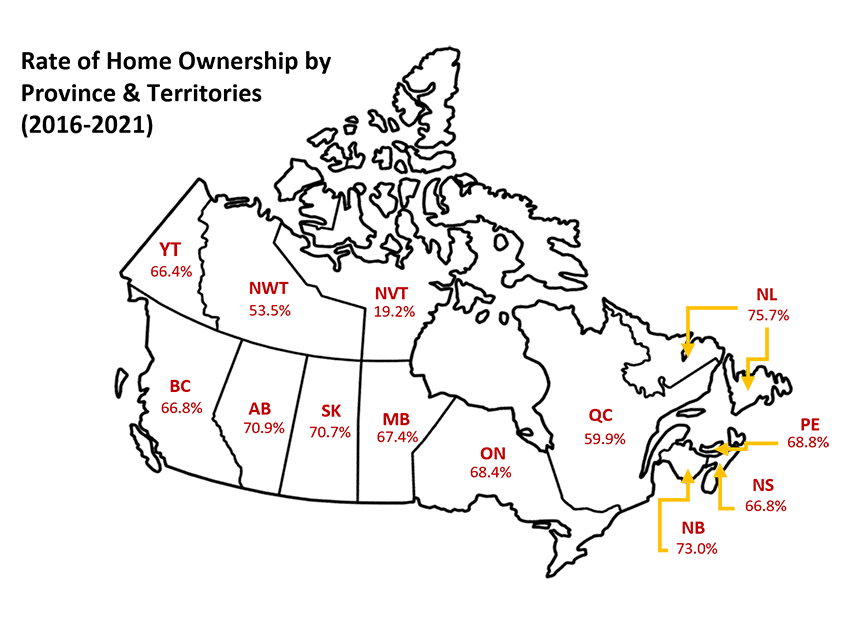
There are differences in homeownership rates across provinces, but these differences are driven more by historical tenure preferences (e.g., Québec with higher rental preference) and urban/rural differences across provinces.
-
Figure 22 - Text version
Home ownership and rental rates of select countries Country or Region Rate of household tenure by country (percentage) Own Rent Other European Union (EU) 75.6% 18.1% 6.3% OECD 71.5% 23.5% 5.0% United Kingdom 67.3% 31.1% 1.6% France 61.7% 36.0% 2.3% Australia 63.0% 32.1% 4.9% Canada 69.2% 30.8% United States 65.5% 32.7% 1.8% Germany 43.8% 53.9% 2.3% Sweden 58.4% 39.4% 2.2% Source: OECD, Housing Tenures, country reporting between 2017-2020
Source: OECD, Housing Tenures, country reporting 2017-2020

-
Figure 23 - Text version
The homeownership rate in Canada has only recently been declining from peaks in 2006-2011 Year Homeownership rate (percentage) 1971 60.3% 1976 61.8% 1981 62.1% 1986 62.4% 1991 62.6% 1996 63.6% 2001 65.8% 2006 68.4% 2011 69.0% 2016 67.8% 2021 66.5% Source: Statistics Canada, Census of Population, 1971 to 2021 (3901),and National Household Survey
Source(s): Census of Population, 1971 to 2021 (3901), and National Household Survey, 2011
-
Figure 24 - Text version
Rate of Home Ownership by Province & Territories (2016-2021) Province or Territory Homeownership rate (percentage) Alberta 70.9% British Columbia 66.8% Manitoba 67.4% New Brunswick 73.0% Newfoundland & Labrador 75.7% Nova Scotia 66.8% Northwest Territories 53.5% Nunavut 19.2% Ontario 68.4% Québec 59.9% Prince Edward Island 68.8% Saskatchewan 70.7% Yukon 66.4% Source: Statistics Canada, Census of Population (2021)
Source: Statistics Canada, Census of Population 2021
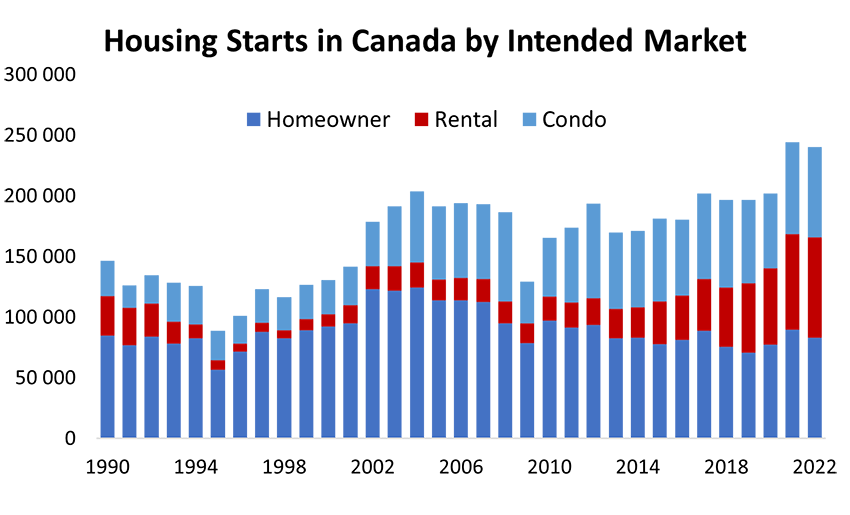
Canada's housing system has long targeted homeownership
From the early 1980s until recently, condominiums and other secondary options were the market response to rental demand.
Construction of purpose-built rental structures has declined significantly since the '60s and '70s. This has been linked to the rise of 'condominiums' as a housing type, changes in the tax code removing incentives to build rental structures, rent-control legislation, and increased macroeconomic stability.
The size of Canada's social rental housing stock (approximately 4%) is also comparatively low compared to other G7 countries, which contributes to upward demand pressures on the private rental market.
-
Figure 25 - Text version
Housing Starts in Canada by Intended Market Year Homeowner Rental Condo 1990 85,194 32,201 29,359 1991 77,252 30,552 18,649 1992 84,319 27,318 23,250 1993 78,382 18,263 32,017 1994 82,643 11,725 31,686 1995 56,890 7,998 24,153 1996 71,599 6,647 23,076 1997 88,021 7,582 27,517 1998 82,896 6,531 27,351 1999 89,204 9,276 28,434 2000 92,307 10,155 28,319 2001 95,153 14,746 31,986 2002 123,199 19,013 36,798 2003 121,996 20,118 49,284 2004 124,741 20,432 58,869 2005 114,059 17,210 60,259 2006 113,897 18,552 61,915 2007 112,882 18,636 61,637 2008 94,975 18,288 73,671 2009 78,712 16,239 34,417 2010 97,210 19,774 48,523 2011 91,459 20,800 61,804 2012 93,632 22,016 77,985 2013 82,891 24,335 62,938 2014 83,137 25,355 62,960 2015 77,869 35,176 68,226 2016 81,456 36,637 62,520 2017 88,892 42,844 70,335 2018 75,607 49,163 72,226 2019 70,908 57,050 68,723 2020 77,619 62,742 62,016 2021 89,808 78,746 75,857 2022 83,265 82,921 74,268 Source: CMHC Starts and Completions Survey
Source: CMHC Starts and Completions Survey

-
Figure 26 - Text version
Relative size of the social rental housing stock Country or Region % of total housing stock Reporting Year Germany 2.7% 2019 Japan 3.2% 2013 Canada 3.5% 2019 United States 3.6% 2019 Australia 4.4% 2017 OECD 7.0% - European Union (EU) 7.5% - France 14.0% 2018 United Kingdom (UK) 16.7% 2019
Source: OECD, Affordable Housing Database
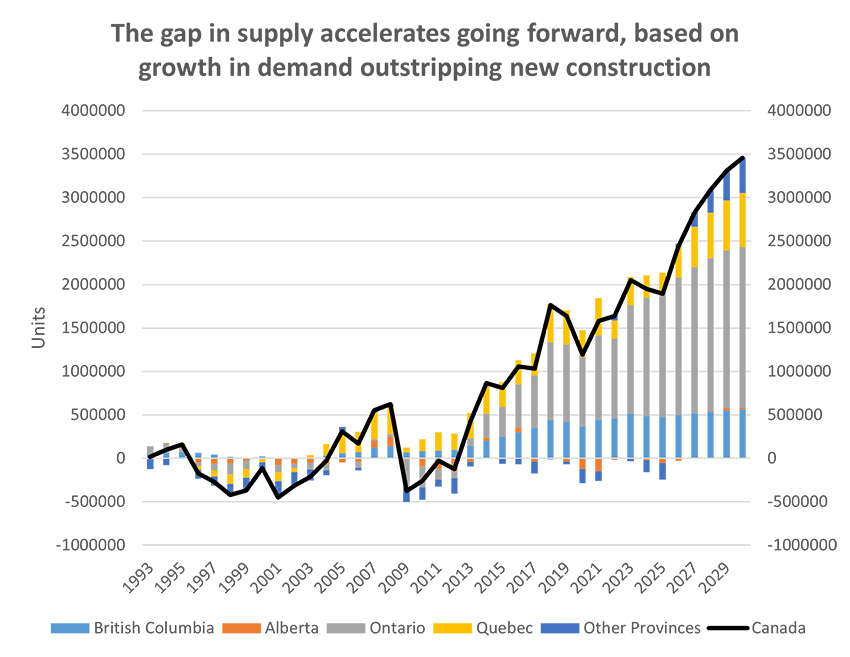
Current and future housing supply challenges in perspective
There is already a significant housing supply gap in Canada, based on historical patterns, which is a major driver of Canada's housing affordability challenges. Presently that gap is approximately 2 million homes. By 2030, it is estimated that this will increase to over 3.5 million more homes required in addition to business as usual.
-
Figure 27 - Text version
The gap in supply accelerates going forward, based on growth in demand outstripping new construction Year British Columbia Alberta Ontario Quebec Other Provinces Canada 1993 48,000 1,000 91,000 -3,000 -118,000 19,000 1994 67,000 5,000 103,000 3,000 -78,000 100,000 1995 75,000 3,000 80,000 10,000 -8,000 160,000 1996 62,000 -48,000 -42,000 -41,000 -103,000 -172,000 1997 44,000 -63,000 -76,000 -68,000 -109,000 -272,000 1998 17,000 -59,000 -123,000 -114,000 -141,000 -420,000 1999 5,000 -27,000 -97,000 -101,000 -151,000 -371,000 2000 21,000 -2,000 -7,000 -41,000 -84,000 -113,000 2001 -3,000 -73,000 -85,000 -105,000 -184,000 -450,000 2002 4,000 -65,000 -50,000 -42,000 -160,000 -313,000 2003 9,000 -53,000 -73,000 28,000 -127,000 -216,000 2004 34,000 -63,000 -73,000 132,000 -57,000 -27,000 2005 58,000 -50,000 1,000 254,000 47,000 310,000 2006 73,000 -40,000 -69,000 232,000 -28,000 168,000 2007 123,000 81,000 17,000 306,000 25,000 552,000 2008 139,000 113,000 29,000 313,000 28,000 622,000 2009 66,000 -14,000 -324,000 59,000 -164,000 -377,000 2010 81,000 -89,000 -246,000 140,000 -143,000 -257,000 2011 90,000 -119,000 -126,000 211,000 -81,000 -25,000 2012 98,000 -147,000 -82,000 186,000 -177,000 -122,000 2013 142,000 -44,000 90,000 290,000 -48,000 430,000 2014 205,000 29,000 278,000 333,000 21,000 866,000 2015 251,000 -8,000 342,000 282,000 -57,000 810,000 2016 298,000 58,000 495,000 276,000 -70,000 1,057,000 2017 351,000 -39,000 606,000 252,000 -136,000 1,034,000 2018 440,000 9,000 883,000 445,000 -12,000 1,765,000 2019 421,000 -37,000 890,000 390,000 -29,000 1,635,000 2020 365,000 -122,000 803,000 310,000 -164,000 1,192,000 2021 442,000 -149,000 971,000 430,000 -113,000 1,581,000 2022 464,000 -18,000 914,000 207,000 70,000 1,637,000 2023 512,000 2,000 1,248,000 322,000 -32,000 2,052,000 2024 489,000 -22,000 1,360,000 257,000 -135,000 1,949,000 2025 476,000 -52,000 1,441,000 219,000 -191,000 1,893,000 2026 497,000 -26,000 1,584,000 360,000 28,000 2,443,000 2027 518,000 0 1,684,000 464,000 168,000 2,834,000 2028 536,000 14,000 1,754,000 523,000 260,000 3,087,000 2029 553,000 24,000 1,816,000 577,000 342,000 3,312,000 2030 561,000 22,000 1,850,000 619,000 407,000 3,459,000 Source: CMHC calculations. See Canada's Housing Supply Shortages: Estimating what is needed to solve Canada's housing affordability crisis by 2030
Source: CMHC calculations. See Canada's Housing Supply Shortages: Estimating what is needed to solve Canada's housing affordability crisis by 2030
At current rates of new construction, Canada's housing stock will increase by 2.3 million units between 2021 and 2030. This will reach close to 19 million housing units by 2030.
Estimated that over 22 million housing units by 2030 are required to return to historically affordable levels.
The challenge is greater than the money required to build more homes, for example:
- Variable costs. The capital required for 3.5 million additional homes does not account for costs to achieve Net Zero, infrastructure or other costs.
- Skilled labor shortages. Under a best-case scenario, labour capacity exists only to increase housing starts activity across all four major provinces between 2022 – 2030 but not enough to close the gaps.
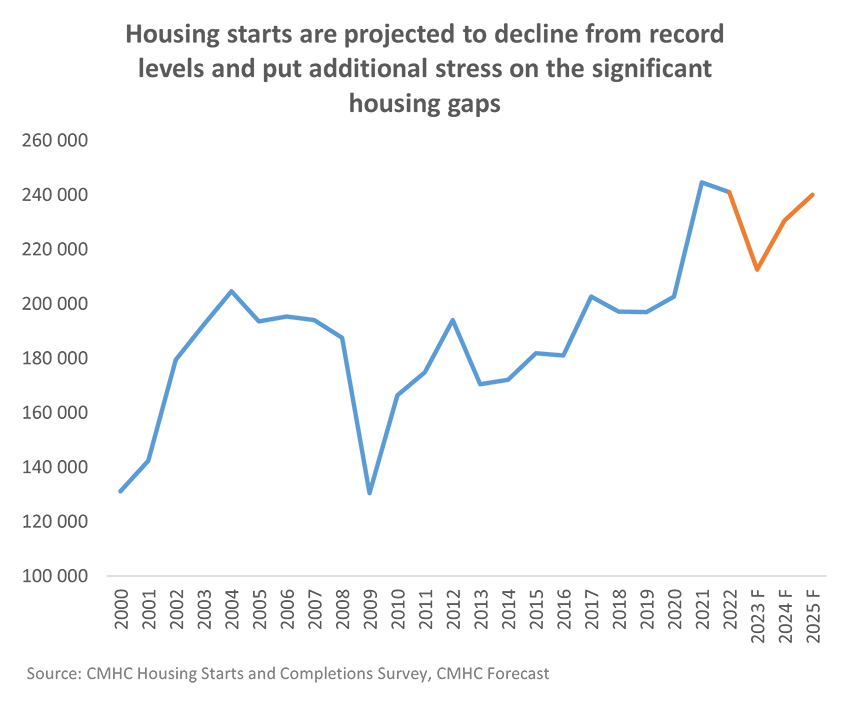
Short-term outlook not favourable to increasing supply
-
Figure 28 - Text version
Housing starts are projected to decline from record levels and put additional stress on the significant housing gaps Year Historical and Forecast Housing Starts in Canada 2000 151,653 2001 162,733 2002 205,034 2003 218,426 2004 233,431 2005 225,481 2006 227,395 2007 228,343 2008 211,056 2009 149,081 2010 189,930 2011 193,950 2012 214,827 2013 187,923 2014 189,329 2015 195,535 2016 197,916 2017 219,763 2018 212,843 2019 208,685 2020 217,880 2021 271,198 2022 261,849 2023 F 211,917 2024 F 223,783 2025 F 235,347 Source: CMHC Housing Starts and Completions Survey, CMHC Forecast
Source: CMHC Housing Starts and Completions Survey, CMHC Forecast
Housing starts to decline significantly from 2021 and 2022 record levels. This outlook will likely put additional stress on the significant housing supply gap (the number of housing units required to restore affordability by 2030).
Higher interest rates will likely worsen supply-side challenges. Higher financing costs may impede new developments while potentially discouraging condominium investors' supply of units to the secondary rental market.
Labour shortages and other construction costs also continue to impede housing starts, exacerbating shortfalls in housing supply.
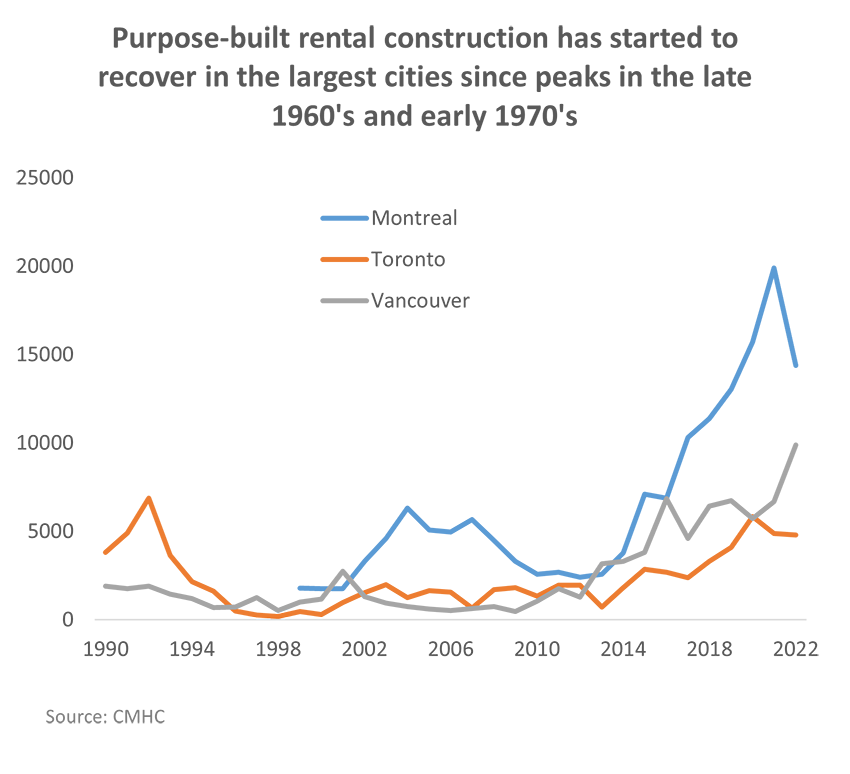
Rental supply outpaced by demand
Even though supply of purpose-built rental structures has increased over the last five years, it still falls short of demand as reflected by lower vacancy rates. Further, recent upticks in new supply may be short lived, with many projects with financing previously secured and credit availability constraining new starts.
-
Figure 29 - Text version
Purpose-built rental construction has started to recover in the largest cities since peaks in the late 1960's and early 1970's Year Montreal Toronto Vancouver 1990 4,903 1,738 1991 6,859 1,901 1992 3,636 1,435 1993 2,143 1,181 1994 1,597 669 1995 482 715 1996 250 1,248 1997 167 499 1998 867 455 988 1999 1,776 277 1,145 2000 1,747 956 2,721 2001 1,745 1,511 1,302 2002 3,309 1,981 944 2003 4,589 1,238 746 2004 6,318 1,649 586 2005 5,069 1,559 509 2006 4,947 661 615 2007 5,648 1,691 748 2008 4,472 1,816 447 2009 3,292 1,338 1,054 2010 2,565 1,934 1,755 2011 2,664 1,951 1,277 2012 2,406 709 3,149 2013 2,576 1,803 3,286 2014 3,771 2,842 3,810 2015 7,094 2,667 6,841 2016 6,865 2,364 4,591 2017 10,302 3,290 6,425 2018 11,380 4,090 6,727 2019 13,036 5,829 5,707 2020 15,711 4,869 6,683 2021 19,900 4,786 9,867 2022 14,375 4,903 1,738 Source: CMHC
Source: CMHC

-
Figure 30 - Text version
Even recent supply growth strength was outpaced by stronger growth in demand for purpose-built rental in most centres in 2022 Centres Change in Supply Change in Demand Vancouver 3.3% 3.6% Victoria 5.0% 4.6% Edmonton 4.0% 7.4% Calgary 8.0% 10.7% Winnipeg 3.5% 6.0% Hamilton 0.1% 1.1% Toronto 2.2% 5.4% Ottawa 6.6% 8.0% Montreal 1.4% 2.4% Halifax 2.5% 2.5% Canada 2.6% 3.8% Source: CMHC
Canada total includes all centres of 10,000+ population
Source: CMHC
Canada total includes all centres of 10,000+ population
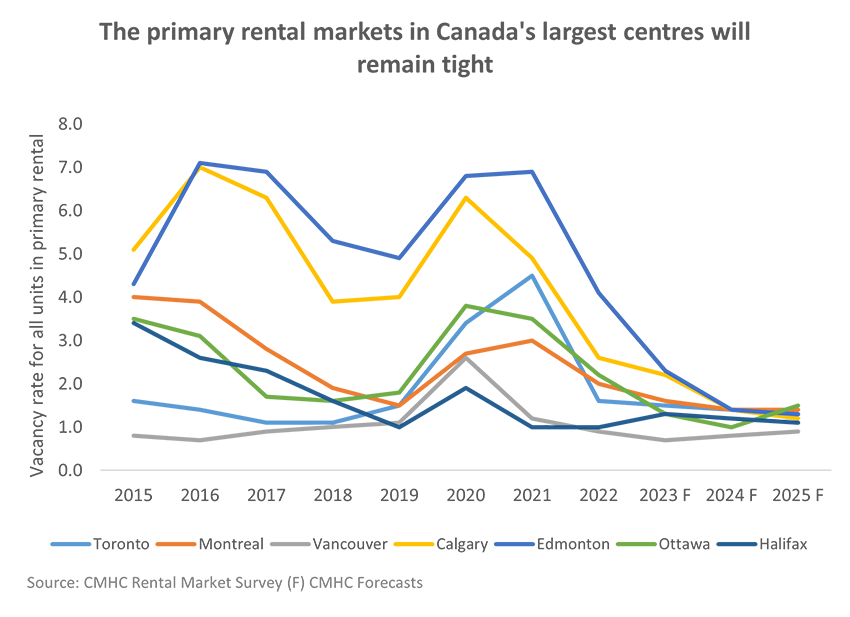
Rental market tightening as population and ownership prices grow
Demand for rental housing has been driven by household formation and likely downward pressures from the ownership segment (as people unable to afford to buy choose to rent for longer). This, combined with years of undersupply in the purpose-built segment and reliance on the secondary market for rentals have contributed to the upward pressures on rents.
-
Figure 31 - Text version
The primary rental markets in Canada's largest centres will remain tight Year Toronto Montreal Vancouver Calgary Edmonton Ottawa Halifax 2015 1.6 4.0 0.8 5.1 4.3 3.5 3.4 2016 1.4 3.9 0.7 7.0 7.1 3.1 2.6 2017 1.1 2.8 0.9 6.3 6.9 1.7 2.3 2018 1.1 1.9 1.0 3.9 5.3 1.6 1.6 2019 1.5 1.5 1.1 4.0 4.9 1.8 1.0 2020 3.4 2.7 2.6 6.3 6.8 3.8 1.9 2021 4.5 3.0 1.2 4.9 6.9 3.5 1.0 2022 1.6 2.0 0.9 2.6 4.1 2.2 1.0 2023 F 1.5 1.6 0.7 2.2 2.3 1.3 1.3 2024 F 1.4 1.4 0.8 1.4 1.4 1.0 1.2 2025 F 1.3 1.4 0.9 1.2 1.3 1.5 1.1 Source: CMHC Rental Market Survey, (F) CMHC Forecasts
Source: CMHC Rental Market Survey (F) CMHC Forecasts

-
Figure 32 - Text version
Affordability deteriorated as rent outpaced wage in some regions and notably in ON and BC where challenges are most acute Province 2022 Rental Consumer Price Index (CPI) Growth 2022 Wage growth 20-year Average Rental Consumer Price Index (CPI) (2001-2021) Prince Edward Island 11% 3% 2% Ontario 6% 2% 1% British Columbia 6% 4% 1% Nova Scotia 5% 4% 1% Alberta 2% 3% 2% Manitoba 3% 3% 2% Quebec 4% 4% 1% Saskatchewan 2% 3% 2% Newfoundland and Labrador 3% 5% 2% New Brunswick 6% 8% 1% Source: Statistics Canada. Rental cost as measured in the consumer price index (CPI)
Source: Statistics Canada
Rental cost as measured in the consumer price index (CPI)
Choices for low-income renters are limited
Affordable units for low-income renters in the primary rental market are extremely rare outside of Quebec. This is a result of an extended period of very low purpose-built rental activity. This puts downward pressures on affordable and social housing options and increases the potential of further marginalization of populations already in vulnerable positions.

-
Figure 33 - Text version
Share of units affordable to renters with the lowest 20% of incomes for select CMAs Census Metropolitan Areas Share 20% cut-off Montréal 23% 20% Edmonton 13% 20% Regina 8% 20% Saskatoon 7% 20% Calgary 5% 20% Winnipeg 4% 20% Halifax 3% 20% Victoria 1% 20% Vancouver 1% 20% Toronto ** 20% Hamilton ** 20% Ottawa ** 20% Source: CMHC
**Data suppressed because the universe is too small and/or to preserve data reliability.
Source: CMHC
** Data suppressed because the affordable universe is too small and/or to preserve data reliability.
| Census Metropolitan Areas | Low-income cut-off for lowest income quintile | Maximum affordable monthly rent | Average One-Bedroom Rent (2022) |
|---|---|---|---|
| Montréal | $30,000 | $749 | $912 |
| Edmonton | $36,000 | $899 | $1,070 |
| Regina | $32,000 | $799 | $988 |
| Saskatoon | $32,000 | $799 | $1,026 |
| Calgary | $36,000 | $899 | $1,222 |
| Winnipeg | $27,000 | $674 | $1,056 |
| Halifax | $28,000 | $699 | $1,156 |
| Victoria | $29,000 | $724 | $1,341 |
| Vancouver | $29,000 | $724 | $1,543 |
| Toronto | $28,000 | $699 | $1,527 |
| Hamilton | $28,000 | $699 | $1,198 |
| Ottawa | $28,000 | $699 | $1,347 |
| Source: CMHC Rental Market Survey, Statistics Canada, CMHC Calculation | |||
The rental market is also challenged by age of stock and source of supply
Two characteristics of rental markets will challenge stability and infrastructure – the age of the purpose-built rental stock and the reliance on condominiums and the secondary market to fill rental demand.
Structures will deteriorate with age and will therefore require maintenance and sometimes extensive renovation. The existing stock of purpose-built rentals in Canada is old.
There was a significant slowdown in the rate of rental construction after 1980, which has been attributed in large part to monetary policy in 1980s; the introduction of condominiums as a form of tenure; and/or changes in tax provisions in early 1980s.
Purpose-built rental units are often considered a more stable option for rental markets compared to rented condominiums or other alternatives:
- Long-term focus: Developers and operators typically have a long-term focus on the rental market. Building and renting is done with the intention of renting over extended periods.
- Standardized rental policies: Often have more standardized rental policies and lease agreements than in the secondary rental space.
- Maintenance and repairs: Typically, have dedicated maintenance staff to ensure maintenance and repairs are assessed and addressed.
- Supply and demand dynamics: Purpose-built rental units are often built in response to specific market demand for rental housing.
- Stable rental pricing: These units generally offer more stable rental pricing where alternatives such as rented condominiums can be subject to individual investor discretion.

-
Figure 34 - Text version
Percent of the purpose-built rental stock by age of construction Toronto Montréal Vancouver Calgary Edmonton Ottawa Halifax Before 1940 8% 32% 4% 2% 1% 8% 7% 1940 - 1959 16% 12% 11% 3% 2% 11% 5% 1960 - 1974 56% 26% 50% 35% 38% 46% 20% 1975 - 1989 13% 15% 12% 27% 25% 17% 19% 1990 - 2009 2% 5% 8% 2% 6% 4% 23% 2010 or Later 5% 10% 16% 31% 27% 14% 26% Source: CMHC Rental Market Survey

-
Figure 35 - Text version
Estimated percent of renter households in purpose-built rental structures (2022) Centre Percentage of renters occupying purpose-built rental structures in 2022 Montréal 73.3% Edmonton 49.6% Calgary 29.5% Halifax 65.2% Vancouver 29.6% Toronto 41.5% Ottawa 35.5% Source: CMHC Rental Market Survey, Statistics Canada Census 2016, CMHC estimate
Source: CMHC Rental Market Survey, Statistics Canada Census 2016, CMHC estimate
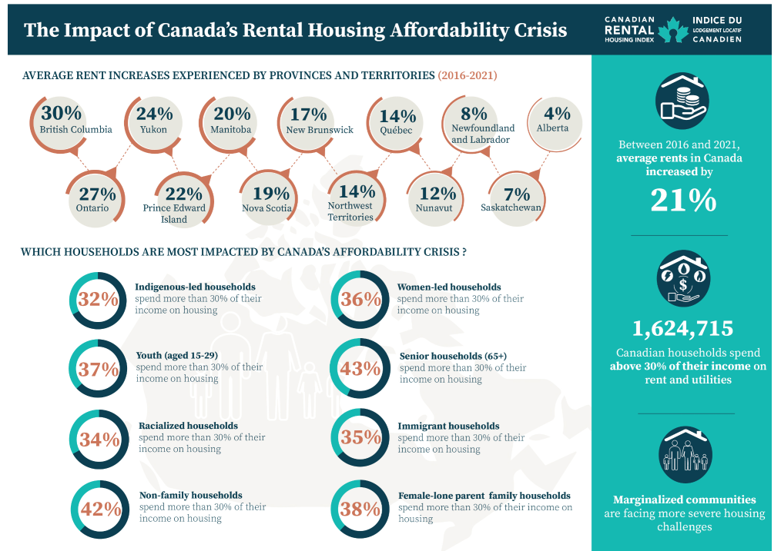
Who is being impacted by the rental supply challenge?
Continued deterioration in market conditions has made rental affordability even more challenging, particularly for households experiencing vulnerabilities.
Note: New households looking to rent, households moving within the rental market, or households transitioning from non-market to market, are facing significantly higher price growth compared to average.
Between 2021-22, 13.6% of rental units turned over in Canada. While average rents increased 2.9%, rents in turnover units increased by 18.3% (CMHC Rental Market Report, January 2023).
-
Figure 36 - Text version
The impact of Canada's rental housing affordability crisis
Average rent increases experienced by Canadian Provinces and Territories from 2016-2021 Province Average rent increases 2016-2021 (percentage) Alberta 4% British Columbia 30% Manitoba 20% New Brunswick 17% Newfoundland & Labrador 8% Nova Scotia 19% Northwest Territories 14% Nunavut 12% Ontario 27% Québec 14% Prince Edward Island 22% Saskatchewan 7% Yukon 24% Source: Canada Mortgage and Housing Corporation
Which households most impacted by Canada's affordability crisis? Household type Percentage (%) of total household type spending more than 30% of income on housing Indigenous-led households 32% Youth (aged 15-29) 37% Racialized households 34% Non-family households 42% Women-led households 36% Senior households (65+) 43% Immigrant households 35% Female-lone parent family households 38% Source: Canadian Rental Housing Index
Between 2016 and 2021, average rents in Canada increased by 21%
1,624,715 Canadian households spend above 30% of their income on rent and utilities
Marginalized communities are facing more severe housing challenges
Aging social and affordable housing stock
Close to a quarter of a million households are on a social and affordable housing wait list, 2/3 of which have been waiting two years or longer. Close to 1/3 of social and affordable housing is in need of repair.
- In 2021, approximately 623,000 households in Canada lived in social and affordable housing (i.e., non-market rental housing).
- This represents over 1 in 10 renter households (11.9%).
- Close to 227,100 households were on a wait list for social and affordable housing in 2021, which represents a 13% decrease from 2018 (262,000). Of those on a waitlist, nearly twice as many households reported waiting two years or longer compared with those waiting less than two years.
- In 2021, close to a third of social and affordable housing units (32.8%) were in need of repair (22% minor repair, 10.8% major repair). As context, 53% of the stock was built before 1980.
Sources: Statistics Canada, Housing challenges remain for vulnerable populations in 2021; Statistics Canada Housing suitability and dwelling condition, by tenure including social and affordable housing
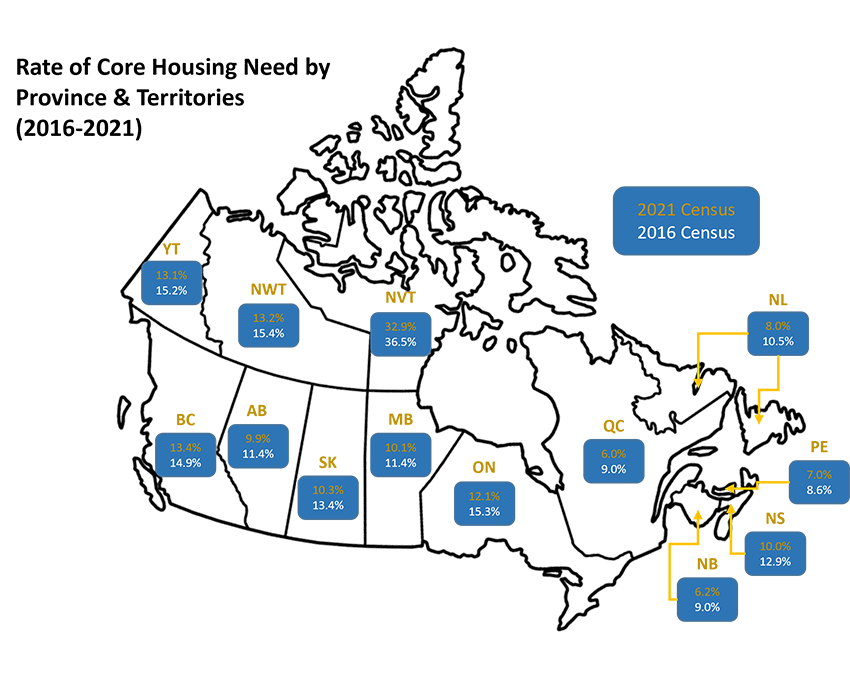
Core housing need is higher in certain regions and populations
A household is in Core Housing Need (CHN) if: i) its housing does not meet one or more of the affordability, adequacy or suitability standards, and ii) it would have to spend 30% or more of its before-tax income to access local housing that meets all three standards.
While the national average rate of CHN decreased from 2016 to 2021, the rate of CHN in the territories, ON, and BC remained well above the national average.
The rate of unaffordable housing declines between 2016-2021, especially among lower-income renters, was largely because of temporary income supports and COVID-19 benefits on household incomes.
Nunavut had the highest rate of CHN at over 3 times the national average.
Racialized groups, Indigenous people and female lone parents remain the highest populations in CHN.
-
Figure 37 - Text version
Rate of Core Housing Need by Province & Territories (2016-2021) Province 2016 2021 Alberta 11.4% 9.9% British Columbia 14.9% 13.4% Manitoba 11.4% 10.1% New Brunswick 9.0% 6.2% Newfoundland & Labrador 10.5% 8.0% Nova Scotia 12.9% 10.0% Northwest Territories 15.4% 13.2% Nunavut 36.5% 32.9% Ontario 15.3% 12.1% Québec 9.0% 6.0% Prince Edward Island 8.6% 7.0% Saskatchewan 13.4% 10.3% Yukon 15.2% 13.1% Source: Statistics Canada, Canada Mortgage and Housing Corporation
The state of housing – A summary
The challenges surrounding housing affordability and supply are complex, multi-jurisdictional, and beyond any individual organization or government's capacity to address.
While the government has committed significant resources to achieving housing goals, these issues continue to evolve and challenge the government's existing approaches.
There have been renewed calls for stronger federal governance and coordination for housing and homelessness policy from key actors such as the Office of the Auditor General, the Federal Housing Advocate, and the National Housing Council.
There is no simple solution when it comes to housing, and the federal response has to pull on the various levers at our disposal, including immigration, skills programming, tax policy, infrastructure investments, and many more.
Housing is a provincial/territorial jurisdiction and we will need to work with all orders of government (PT and municipal), as well as with the private and non-profit sectors to address the housing needs of Canadians.
Key housing terminology
- Affordability/
Affordable Housing - In Canada, housing is considered "affordable" if it costs less than 30% of a household's before-tax income. "Affordable housing" is a very broad term that can include housing provided by the private, public and non-profit sectors. It also includes all forms of housing tenure: rental, ownership and co-operative ownership, as well as temporary and permanent housing.
- Social/ Community Housing
- An umbrella term that typically refers to either housing that is owned and operated by non-profit housing societies and housing co-operatives, or housing owned by provincial, territorial or municipal governments.
- Core Housing Need
- A household is in core housing need if its housing does not meet one or more of the adequacy, suitability or affordability standards and it would have to spend 30% or more of its before-tax income to pay the median rent (including utility costs) of alternative local market housing that meets all three standards:
Affordable (see above)
Adequate – Housing does not require any major repairs, according to residents. Major repairs include those to defective plumbing or electrical wiring, or structural repairs to walls, floors or ceilings.
Suitable – Housing has enough bedrooms for the size and make-up of resident households, according to guidelines outlined in National Occupancy Standard. - Purpose-Built Rental
- Housing built specifically for long-term rental accommodation.
Part C: The state of homelessness
Key definitions
Homelessness Footnote 6
The situation of an individual or family who does not have a permanent address or residence; the living situation of an individual or family who does not have stable, permanent, appropriate housing, or the immediate prospect, means and ability of acquiring it.
- Often the result of systemic or societal barriers, including a lack of affordable and appropriate housing, the individual/household's financial, mental, cognitive, behavioural or physical challenges, and/or racism and discrimination.
Chronic homelessness Footnote 7
Refers to individuals who are currently experiencing homelessness AND who meet at least 1 of the following criteria:
- they have a total of at least 6 months (180 days) of homelessness over the past year; or
- they have recurrent experiences of homelessness over the past 3 years, with a cumulative duration of at least 18 months (546 days).
Despite significant federal investments, homelessness is increasing
More people are experiencing homelessness
In communities that participated in the last two nationally coordinated Point-in-Time counts, there was an 20% increase in the number of people experiencing homelessness between 2017-2018 and 2020-2022.
More than three quarters of these communities observed an increase in unsheltered homelessness (e.g. staying in encampments). In fact, unsheltered homelessness has nearly doubled across the country.
People are staying in shelters for longer periods
Between 2005 and 2020, the number of people using shelters decreased, but shelter stays got longer.
Between 2020 and 2021, the total number of shelter users increased and the stay lengths continued to increase.
People accessing family shelters stayed longer (67.1 days) compared to youth (49.1 days) and general shelter users (48.4 days).
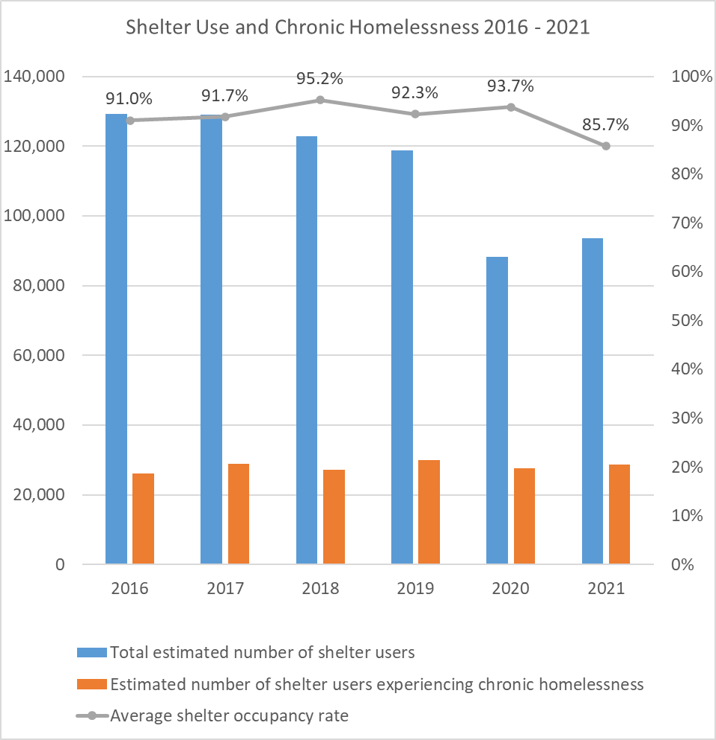
Chronic homelessness in shelters has increased
Between 2016 and 2021, the number of shelter users experiencing chronic homelessness remained consistent despite reductions in total shelter users.
These figures underestimate total chronic homelessness, as data relies on shelter use and not other forms (e.g., unsheltered, hidden homelessness).
-
Figure 38 - Text version
Shelter Use and Chronic Homelessness 2016 – 2021 Year Total estimated number of shelter users Estimated number of shelter users experiencing chronic homelessness Average shelter occupancy rate 2016 129,127 26,083 91.0% 2017 129,017 28,900 91.7% 2018 122,914 27,289 95.2% 2019 118,759 29,927 92.3% 2020 88,342 27,651 93.7% 2021 93,529 28,631 85.7%
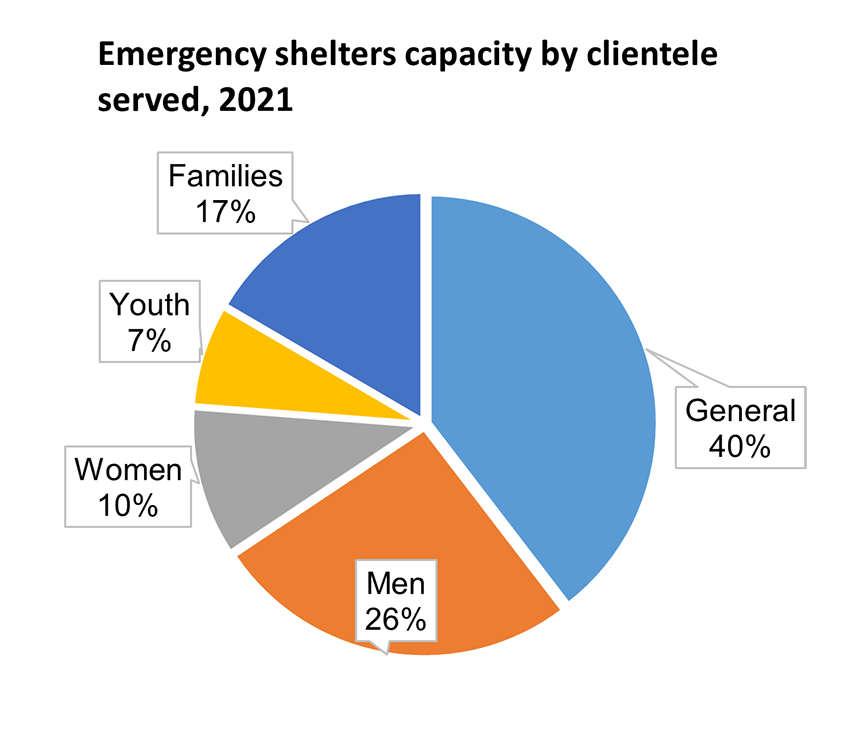
National shelter capacity
40% of the capacity of the emergency shelter system serves adults of all genders
An additional 26% specifically serves men, 10% serves women, 17% serves families, and 7% serves youth.
The COVID-19 pandemic impacted emergency shelter capacity
Over the first months of the COVID-19 pandemic, shelter bed capacity reduced by approximately 21% across jurisdictions before showing signs of recovery by December 2021.
Other permanent shelter capacities have seen continuous growth between 2019 and 2021
Transitional housing facilities have increased by 31% (from 346 to 452) and total beds increased by 6% (from 7,694 to 8,150).
Domestic violence shelters have increased by 12% (from 545 to 612) and total beds increased by 16% (from 7,925 to 9,197).
-
Figure 39 - Text version
Emergency shelters capacity by clientele served, 2021 Clientele Percentage General 40% Men 26% Women 10% Youth 7% Families 17%
| Province and territory | Shelters | Beds | ||
|---|---|---|---|---|
| 2020 | 2021 | 2020* | 2021 | |
| Newfoundland and Labrador | 14 | 14 | 125 | 118 |
| Prince Edward Island | 2 | 3 | 18 | 26 |
| Nova Scotia | 11 | 11 | 243 | 230 |
| New Brunswick | 8 | 9 | 253 | 323 |
| Quebec | 74 | 92 | 1,658 | 2,009 |
| Ontario | 160 | 157 | 7,351 | 6,793 |
| Manitoba | 16 | 19 | 436 | 484 |
| Saskatchewan | 15 | 16 | 407 | 329 |
| Alberta | 30 | 26 | 2,784 | 2,254 |
| British Columbia | 79 | 81 | 2,534 | 2,456 |
| Yukon | 3 | 3 | 59 | 39 |
| Northwest Territories | 3 | 3 | 88 | 65 |
| Nunavut | 3 | 3 | 53 | 59 |
| Canada | 418 | 437 | 16,009 | 15,185 |
| *2020 shelter and bed data is for February 2020. By August 2020 the number of permanent emergency beds available was approximately 21% lower. However, many shelters were able to extend their services to temporary bed capacity locations such as leased hotels/motels and permanent. Shelter capacity data for 2022 will be released by the end of fall 2023. | ||||
Homelessness in Canada: 2020-22 Point-in-time counts
Experiences of homelessness go beyond shelter use (e.g., couch surfing, rough sleeping, lack of access to shelters in rural communities, etc.). Nationally-coordinated Point-in-Time counts and surveys provide information on homelessness outside of shelters. Nearly one in four respondents to the 2020-22 surveyFootnote 8 reported that they did not use a shelter in the past year (24%).
-
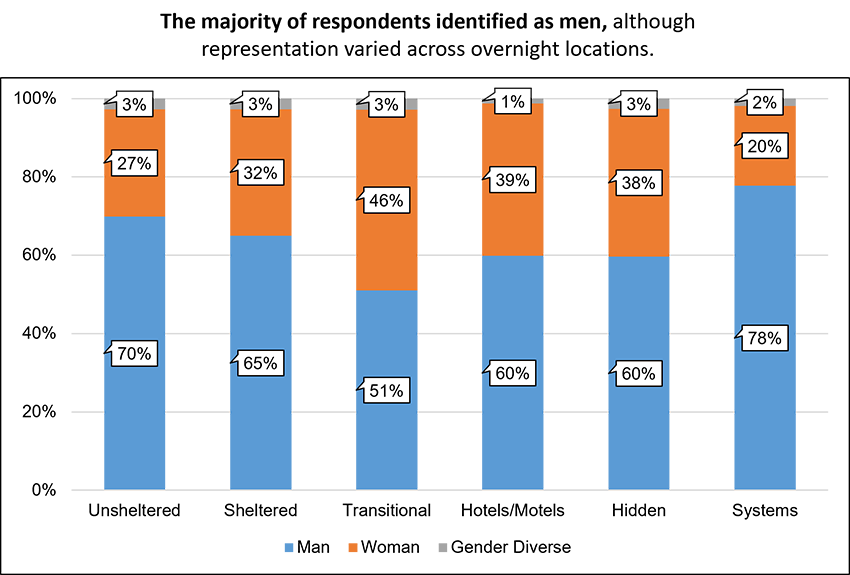
Figure 40 - Text version
The majority of respondents identified as men, although representation varied across overnight locations.
Breakdown of gender identity per housing situations from 2020 -2022 Point-in-Time counts Gender Identity Unsheltered Sheltered Transitional Hotels/ Motels Hidden Systems Man 70% 65% 51% 60% 60% 78% Woman 27% 32% 46% 39% 38% 20% Gender Diverse 3% 3% 3% 1% 3% 2%
-
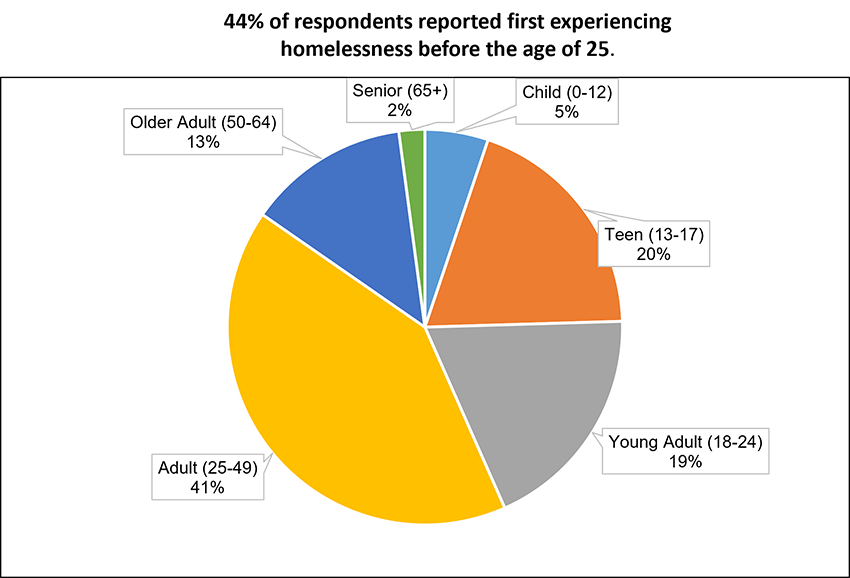
Figure 41 - Text version
44% of respondents reported first experiencing homelessness before the age of 25.
Breakdown of age groups of respondents' first experience of homelessness (2020 -2022 Point-in-Time counts) Age group Percentage Child (0-12) 5% Teen (13-17) 20% Young Adult (18-24) 19% Adult (25-49) 41% Older Adult (50-64) 13% Senior (65+) 2%
Counts took place between March 2020 and December 2022, due to the COVID-19, pandemic. Previous counts took place in 2016 and 2018.
Homelessness in Canada: Demographics
Indigenous persons are overrepresented (and still likely underestimated) among the homeless population, representing 39% of shelter users, but comprising 5% of the Canadian population.
Over 10% of shelter users moved to Canada as a newcomer, either as an immigrant (9.5%), refugee (1.7%), or refugee claimant (2.2%).
Men, older adults, Canadians, veterans, and Indigenous shelter users are more likely to experience longer forms of chronic homelessness, whereas women and youth are more likely than other groups to use shelters extensively over a shorter period.
One in four (25%) youth responding to Point-in-Time counts identify as 2SLGBTQI+. The proportion is smaller among older age groups, accounting for 13% of adults, 6% of older adults, and 6% of seniors.
In addition, 1 in 20 people experiencing homelessness identify as veterans of the Canadian Armed Forces and RCMP, and tend to be older than non-veterans.
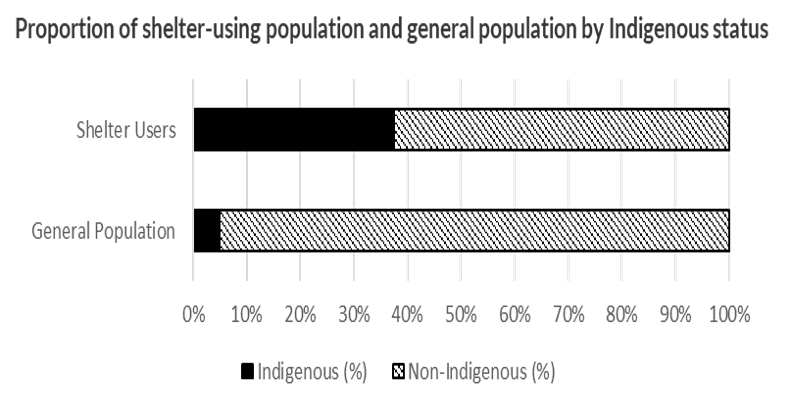
-
Figure 42 - Text version
Proportion of shelter-using population and general population by Indigenous status Population Indigenous Non-Indigenous Shelter Users 39% 61% General Population 5% 95%
-
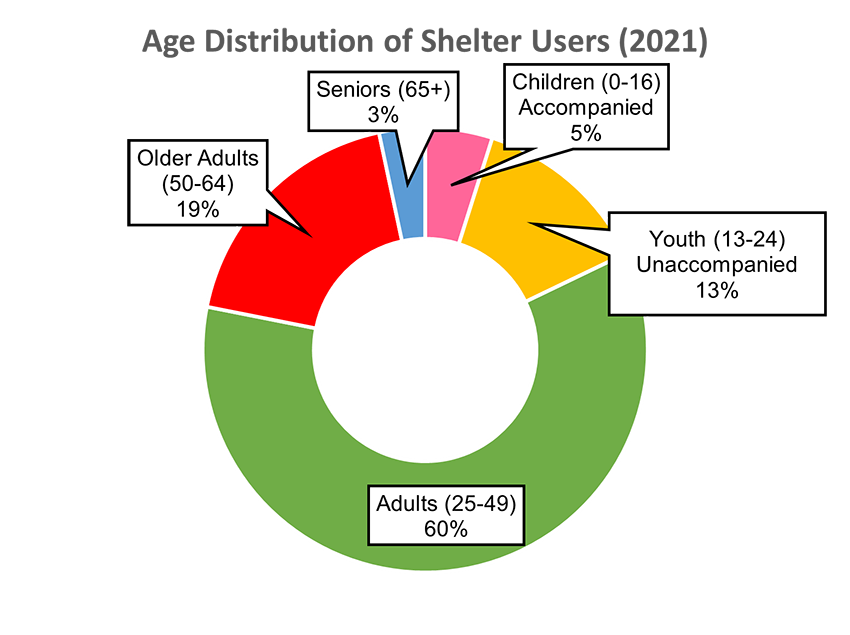
Figure 43 - Text version
Age distribution of Shelter Users (2021) Age group Percentage Children (0-16) Accompanied 5% Youth (13-24) Unaccompanied 13% Adults (25-49) 60% Older Adults (50-64) 19% Seniors (65+) 3%
Economic trends and contributing factors to homelessness
Increasing cost of living and inadequate incomes are leading to housing instability and food insecurity
Rising costs of housing, food, and other necessities are outpacing wages. Canadians are now less likely to afford a place to live and having difficulty feeding their families.
Increases in social benefits are insufficient; people receiving benefits living with below-poverty and deep-poverty incomes.
34% of homeless individuals receive disability benefits; half receive social assistance.

-
Figure 44 - Text version
Insufficient income was the most reported reason for homelessness (PiT 2020-22)
Insufficient income was the most reported reason for homelessness (PiT 2020-22) Reason Percentage Insufficient income 28% Substance use issues 17% Conflict with landlord 15% Conflict with partner 14% Unsafe housing 11%
Housing prices, rental costs, and a lack of available units is contributing to the affordable housing crisis in Canada
Canada's house price to income ratio is above any other G7 nation and increased almost 20% between 2016 to 2021.
Social housing accounts for only 3.5% of Canada's housing stock, well below the 7% OECD average.
Social assistance recipients are struggling with basic needs due to a lack of affordable housing.
In 2021, 1 in 10 households were in core housing need, over 75% of them facing affordability challenges.
Average rent in Canada has grown 3% but rent for turnover units grew 18.3% between 2021 and 2022, presenting a significant barrier for those entering the rental market or looking to move units.
Homelessness policy intersections
Healthcare
40% have an illness or medical condition, 60% mental health challenges, and 61% substance use issues.
36% have a physical disability.
Experiences of homelessness worsen health outcomes.
Corrections
More likely to interact with the justice system.
30% of federal offenders are released into homelessness and face significant barriers to housing.
People with a history of incarceration are 7% more likely to experience chronic homelessness.
Immigration
Immigration levels significantly outpacing ability to create additional housing units.
International students are more likely to experience core housing need or face discrimination while searching for housing.
Refugees are disproportionately impacted by homelessness (1.4% of the population compared to 3.1% of shelter users in 2019).
Homelessness in Canada: Pathways into homelessness
Homelessness is generally caused by one or a combination of factorsFootnote 9:
Structural factors, such as economic and societal issues that affect opportunities, environments, and outcomes for individuals.
- Includes poverty, discrimination, lack of affordable housing, and the impact of colonialism, intergenerational trauma and racism against Indigenous peoples.
Systems failures, where support services are inadequately delivered.
- Includes barriers to accessing public systems, and failed transitions from publicly funded institutions.
Individual and relational factors where personal circumstances can lead to homelessness.
- Includes crisis situations, mental health and addiction, housing insecurity, and interpersonal and intimate partner violence.
Factors that contribute to housing loss vary by age group:
Insufficient income for housing is the most common reason identified by adults and seniors, and is also commonly cited by youth.
Conflict with a parent/guardian is the most common reason noted by youth.
Substance use issues are also commonly cited across age groups, though this is most prevalent among adults (25-49).
Most common reasons for housing loss by age group
Youth (aged 13-24)
- Conflict with parent/guardian (30%)
- Not enough income (24%)
- Substance use issue (17%)
Adults (aged 25-49)
- Not enough income (28%)
- Substance use issue (21%)
- Conflict with spouse/partner (16%)
Older Adults and Seniors (aged 50+)
- Not enough income (30%)
- Landlord-tenant conflict (16%)
- Substance use issue (13%)
The state of homelessness – A summary
Homelessness is a significant and complex challenge in Canada. It persists despite significant federal investments, and its impacts were exacerbated by the COVID-19 pandemic and rising housing costs.
Although there are many reasons Canadians experience homelessness, the main cause is insufficient income to pay for housing.
The federal government does not hold all the levers to fix this. Preventing, reducing and ultimately ending chronic homelessness will require active participation both across federal institutions and from all levels of government, non-profits organizations and civil society as a whole.
Report a problem on this page
- Date modified: